WIPRO Technologies
Wipro Limited (Western India Products Limited) is an Indian multinational IT consulting and Integration Services Company headquartered in Bangalore, India. As of March 2015, the company has 158,200 employees servicing over 900 of the Fortune 1000 corporations with a presence in 67 countries.
Wipro Limited - Key Parameters
|
BSE Code |
507685 |
|
NSE Code |
WIPRO |
|
Reuters Code |
WIPR.NS |
|
CMP (as on 4/09/2015) |
550 |
|
Stock Beta |
0.78 |
|
52 Week H/L |
512.50 / 677.60 |
|
Market Cap (Cr) |
1,32,000 |
|
Equity Capital (Rs cr) |
493.70 |
|
Face Value (Rs) |
2 |
|
Average Volume |
1,112,521 |
|
Shareholding Pattern (%) |
|
|
Promoters |
73.38 |
|
Institutions |
15.12 |
|
Non Institutions |
9.54 |
|
Custodians |
1.96 |
|
Grand Total |
100 |
Wipro Limited - Potential Catalysts
-
Diversified client base
-
Strong product portfolio
-
Technologies upgradation.
Wipro Limited - Conclusion & Recommendation
Based on the strong product portfolio and geographically diversified presence, ATS Research value the stock at 14.1x PE FY16, which gives a target price of Rs 665. We feel that investors could buy the stock at the CMP for the given target prices over the one year.
We recommend BUY on WIPRO with the target of 665
Wipro Limited - Financial Summary
|
Yearly Financial Statement |
201403 |
201503 |
201603 P |
201703 P |
|
Total Income |
45209.10 |
49303.90 |
53834.09 |
59920.11 |
|
EBIDTA |
11500.20 |
12810.50 |
13701.76 |
15270.08 |
|
EBIT |
10389.60 |
11528.20 |
12330.24 |
13741.58 |
|
Adjusted PAT |
7796.70 |
8652.80 |
9537.14 |
10613.81 |
|
EPS |
31.82 |
35.32 |
39.05 |
43.59 |
|
EBIDTA Margin |
26.28 |
27.07 |
25.98% |
25.98% |
|
EBIT Margin |
25.62 |
26.31 |
23.38% |
23.38% |
|
PAT Margin |
17.82 |
18.29 |
17.72% |
17.71% |
BUSINESS DISCRIPTION
Wipro Limited is a global information technology (IT), services Provider. The Company develops and integrates solutions that enable its clients to leverage IT in achieving their business objectives at competitive costs. The Company uses its quality processes and global talent pool to deliver time to development advantages, cost savings and productivity improvements. The Company’s business comprises of IT Services businesses, which provide a range of IT and IT-enabled services which include IT consulting, custom application design, development, re-engineering and maintenance, systems integration, package implementation, global infrastructure services, BPO services, research and development and hardware and software design to leading enterprises worldwide, and IT Products business segments provides a range of third-party IT products, which include computing, storage, networking, security and software products, including databases and operating systems.
To focus on core IT Business, it demerged its non-IT businesses into a separate company named Wipro Enterprises Limited with effect from 31 March 2013. The demerged companies are consumer care, lighting, healthcare and infrastructure engineering which contributed approximately 10% of the revenues of Wipro Limited in previous financial year.
MANAGEMENT & GOVERNANCE
|
Name |
Designation |
|
Azim H Premji |
Chairman & Managing Director |
|
Narayanan Vaghul |
Director |
|
B C Prabhakar |
Director |
|
Jagdish N Sheth |
Additional Director |
|
Ashok S Ganguly |
Director |
|
William Arthur Owens |
Director |
|
Suresh C Senapaty |
Executive Director & CFO |
|
Shyam Saran |
Director |
|
Henning Kagermann |
Director |
|
T K Kurien |
Executive Director & CEO |
|
M K Sharma |
Director |
|
Vyomesh Joshi |
Director |
|
Ireena Vittal |
Director |
|
Rishad Azim Premji |
Whole-time Director |
|
M Sanaulla Khan |
Company Secretary |
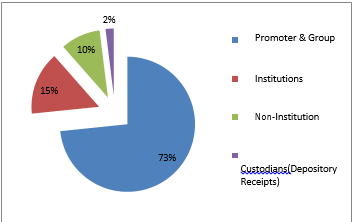
Shareholding pattern as on 4nd Sept, 2015
|
|
No of Shares |
% of Holding |
|
Promoter & Group |
1812022464 |
73.38 |
|
Institutions |
373478502 |
15.12 |
|
Non-Institution |
235459077 |
9.54 |
|
Custodians(Depository Receipts) |
48340758 |
1.96 |
Investment Rationale
Diversified client base
Key wins in the quarter include channel redesign for Allied Irish Bank and customer experience portal transformation for a large US bank.
From a geo perspective, the company saw broad-based growth except for Europe where it saw a decline. Wipro has been delivering strong traction in Europe owing to the company’s strong footprint in the region. The UK and Continental Europe contribute to an equal proportion of revenues from the European region. Going forward, we expect the company to deliver higher traction in Continental Europe owing to the increased adoption of off-shoring. Wipro has recently appointed Mr. Ulrich Meister, an ex T-Systems employee to drive growth in Continental Europe.
IT services revenue grew sequentially by 1.1% RCTG delivered a sequential of 5%. Manufacturing and Hi-Tech business grew by 2.6% Product Engineering has picked up with a 2.3% Analytics grew by 5.8%
Management indicated of increasing focus on the region and expects an uptick aided by improving discretionary demand. Company has been aggressively investing in sales resources to focus on North America. Wipro is also evolving strategies to focus on penetrating key accounts across verticals in the region. We believe that sustainable turnaround of Wipro would hinge upon its ability to regain growth in USA.
Technologies upgradation
Wipro has invested over 70 projects leveraging automation platform. The investment in the 350-member team working on the process hyper simplification and on the HOLMES platform (artificial intelligence platform) impacted roughly about 1000 people have come down in terms of total headcount in the projects.
It has used venture capital arm to invest in companies which can add value to HOLMES and NextGen project and take it to a different level. They also invested in two venture companies, namely, Talena and Vicarious.
Wipro also announced its intention to acquire Designit, one of the largest independent global strategic design firm with a network of 9 global studios and over 300 designers. Designit’s design capabilities in synergy with Wipro’s scale in technology services would position Wipro uniquely, in Digital, as an integrated design & technology player
Wipro partners with Chelsea Football Club, help them to transform their digital journey, fan engagement and in- stadia experience. Chelsea FC, the reigning champions of the English Premier League, is one of the earliest adopters of digital to engage and differentiate themselves – both as team and as a club.
Wipro will support Chelsea FC in this transformation journey by bringing together strategy design and technology.
Valuation
We see Wipro narrowing its growth differential vs. peer set in FY16. We expect revenue growth of Rs 54,000 Cr for FY15/FY16E. Wipro’s 1Q EBIT margin for IT services business is 459 bps lower than industry average.Scope for improvement in utilization rates in IT services could act as a margin lever in FY16.
Wipro is currently trading at 17.79x Q1 FY15 EPS, which implies it is trading at 20% discount with its peers. We believe that risk return profile remains favorable in Wipro. With improving growth/margin trajectory, we see scope for further P/E rerating.
Also our valuation using DCF shows Wipro with the target of 665 for FY16 with growth of 12% to the top line.
|
Peer Compression(June) |
Industry average |
Wipro |
|
OPM % |
31.74 |
27.15 |
|
NPM % |
21.39 |
18.56 |
|
EPS |
65.55 |
32.90 |
|
PE |
21.48 |
17.79 |
|
P/BV |
6.63 |
4.18 |
|
P/EPS |
19.43 |
15.76 |
|
BV |
303.14 |
150.26 |
Conclusion and Recommendation
Based on the strong product portfolio and geographically diversified presence, ATS Research value the stock at 14.1x PE FY16, which gives a target price of Rs 665. We feel that investors could buy the stock at the CMP for the given target prices over the one year.
We recommend BUY on WIPRO with the target of 665
-
Cannibalization is one of the biggest concern company is facing.
Technology industry is not the most forgiving industry in the world. Nowadays technology will be obsolete within one to two generation of its emergence.
-
Wipro’s geographical performance has been a mixed bag. The company has been traditionally weaker in the North American region owing to portfolio gaps in select verticals. Wipro’s weak exposure to large North American banks as well as telecom services companies in that geography has been a drawback.
-
WIPRO deals in the world-wide market. The different market dynamics have a slight bearing on the operations of the company. The Gains of WIPRO Technologies is significantly inter-linked with the growth of the Banking Industry all over the Globe.
-
The rapidly developing markets and the Competition in the market is a major concern for WIPRO.
Financials
Wipro Ltd. key Products/Revenue Segments include Software Services which contributed Rs 35657.60 Cr to Sales Value (86.52% of Total Sales), Networking, Storage equipment, Servers, Software Licenses which contributed Rs 2718.50 Cr to Sales Value (6.59% of Total Sales), I T Enabled Services which contributed Rs 2717.50 Cr to Sales Value (6.59% of Total Sales), Other Services which contributed Rs 85.70 Cr to Sales Value (0.20% of Total Sales), Others which contributed Rs 22.70 Cr to Sales Value (0.05% of Total Sales), Mini Computers/Micro Processor Based Systems which contributed Rs 8.00 Cr to Sales Value (0.01% of Total Sales), for the year ending 31-Mar-2015.
For the quarter ended 30-Jun-2015, the company has reported standalone sales of Rs. 10777.40 Cr., up 1.51% from last quarter Sales of Rs. 10617.50 Cr. and up 8.17% from last year same quarter Sales of Rs. 9963.40 Cr. Company has reported net profit after tax of Rs. 1988.20 Cr. in latest quarter.
It also added healthy headcount growth of about 3,500 to its list.
|
Key Ratios |
201203 |
201303 |
201403 |
201503 |
|
Debt-Equity Ratio |
0.23 |
0.23 |
0.2 |
0.19 |
|
Long Term Debt-Equity Ratio |
0.09 |
0.04 |
0.02 |
0.03 |
|
Current Ratio |
1.60 |
1.53 |
1.62 |
1.9 |
|
Interest Cover Ratio |
21.3 |
28.19 |
27.38 |
33.08 |
|
EBIDTA (%) |
22.25 |
24.3 |
26.61 |
27.15 |
|
EBIT (%) |
19.63 |
21.79 |
24.17 |
24.65 |
|
ROCE (%) |
23.72 |
24.44 |
29.48 |
27.82 |
|
Payout (%) |
27.53 |
29.27 |
25.6 |
36.27 |
|
Yearly Financial Statement |
2014.00 |
2015.00 |
2016 P |
2017P |
2018 P |
|
Total Income |
45209.10 |
49303.90 |
54001.52 |
60293.90 |
67322.88 |
|
Total Expenditure |
33708.90 |
36493.40 |
39970.45 |
44627.90 |
49830.56 |
|
EBIDTA |
11500.20 |
12810.50 |
13745.26 |
15367.20 |
17180.53 |
|
Interest |
289.10 |
359.90 |
394.19 |
440.12 |
491.43 |
|
Depreciation |
1110.60 |
1282.30 |
1375.87 |
1538.22 |
1719.73 |
|
EBIT |
10389.60 |
11528.20 |
12369.39 |
13828.98 |
15460.80 |
|
PBT |
10100.50 |
11168.30 |
12261.01 |
13687.66 |
15281.16 |
|
Tax |
2260.00 |
2462.40 |
2636.12 |
2942.85 |
3285.45 |
|
PAT |
7840.50 |
8705.90 |
9624.90 |
10744.81 |
11995.71 |
|
Adjusted PAT |
7796.70 |
8652.80 |
9566.74 |
10679.88 |
11923.21 |
|
|
|||||
|
EPS |
31.82 |
35.32 |
39.05 |
43.59 |
48.67 |
|
EBIDTA Margin |
26.28% |
27.07% |
25.98% |
25.98% |
25.98% |
|
EBIT Margin |
25.30% |
26.31% |
23.38% |
23.38% |
23.38% |
|
PAT Margin |
17.80% |
18.30% |
17.72% |
17.71% |
17.71% |
- Share :


Post a Comment
|
DISCLAIMER |
This report is only for the information of our customers. Recommendations, opinions, or suggestions are given with the understanding that readers acting on this information assume all risks involved. The information provided herein is not to be construed as an offer to buy or sell securities of any kind. ATS and/or its group companies do not as assume any responsibility or liability resulting from the use of such information.