TATA CONSULTANCY SERVICES
Tata Consultancy Services (TCS) is a global leader, multinational Information Technology service, consulting and business solutions company headquartered in Mumbai, Maharashtra.
TCS has been recognized by Brand Finance as one of the Big 4 Global IT Services Brands.
|
BSE Code |
532540 |
|
NSE Code |
TCS |
|
Reuters Code |
TCS.NS |
|
INCEPTION |
2000 |
|
IPO |
2001 |
|
Industry |
Information Technology Services |
|
CMP (as on 23/09/2015) |
2588.5 |
|
Stock Beta |
0.5281 |
|
52 Week H/L |
2455 / 2834 |
|
Market Cap (Cr) |
506852.81 |
|
Equity Capital (Rs cr) |
195.87 |
|
Face Value (Rs) |
1.00 |
|
Average Volume |
|
|
|
|
|
Shareholding Pattern (%) |
|
|
Promoters |
73.86 |
|
Non Institutions |
26.14 |
|
Grand Total |
100.00 |
Tata Consultancy Services - Potential Catalysts
-
Well diversified client across geography.
-
Margins and ratios expected to improve
-
Efficiency and Higher service level due to streamlined process with Domestic business to focus more on profitability
Tata Consultancy Services - Recommendation
With Superior project management skills, focus on measuring and monitoring quality and its planned expansion TCS will be able to grow over the next few years. We recommend BUY on the stock at CMP of Rs. 2588 to target of Rs. 2773 (115x FY16 EPS).
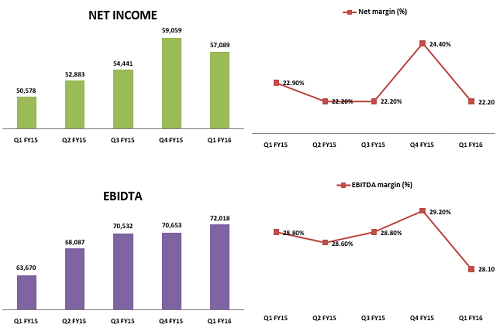
Tata Consultancy Services - Financial Summary
|
Yearly Financial Statement |
2014 |
2015 |
2016 E |
2017 E |
|
Revenue |
83446.1 |
98368.07 |
109443.44 |
123777.84 |
|
EBIDTA |
26789.53 |
28201.37 |
30760.20 |
34869.77 |
|
EBIT |
25440.38 |
26402.68 |
28798.31 |
32645.77 |
|
Adjusted PAT |
19163.87 |
21874.16 |
22475.67 |
25415.44 |
|
EPS |
97.67 |
101.35 |
114.75 |
129.75 |
|
EBIDTA Margin |
32.75% |
29.80% |
28.67% |
28.28% |
|
EBIT Margin |
31.10% |
27.90% |
26.84% |
27.86% |
|
PAT Margin |
22.97% |
22.24% |
20.54% |
21.32% |
BUSINESS DESCRIPTION
Tata Consultancy Services Limited (TCS) is an information technology (IT) services, consulting and business solutions organization. TCS offers a consulting-led, integrated portfolio of IT, Business Process Services (BPS), infrastructure, engineering and assurance services. It services portfolio comprises assurance services, business intelligence (BI) and performance management, business process services, consulting, digital enterprise, engineering and industrial services, enterprise security and risk management, enterprise solutions, iON business, IT infrastructure services, IT services, platform solutions and supply chain management, among others. TCS offers software, including Digital Software and Solutions, TCS BaNCS, TCS MasterCraft and TCS Technology Products. It serves various industries, including Banking and Financial Services, Energy, Government, Healthcare, High Tech, Insurance, Life Sciences, Resources, Retail and Consumer Products, Telecom, Travel, and Utilities.
Tata Consultancy Services Ltd. key Products/Revenue Segments include Information Technology & Consultancy Services which contributed Rs 72160.74 Cr to Sales Value (98.07% of Total Sales), Sale of Equipment & Software Licenses which contributed Rs 1417.32 Cr to Sales Value (1.92% of Total Sales), for the year ending 31-Mar-2015.
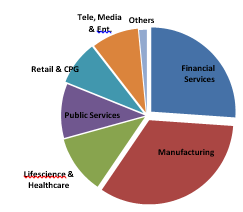
Revenue Distribution
|
In % |
Mar-15 |
Dec-15 |
Mar-15 |
|
Financial Services |
26.9 |
26.6 |
26.1 |
|
Manufacturing |
33.3 |
32.9 |
33.4 |
|
Life science & Healthcare |
10.4 |
11.1 |
11.2 |
|
Public Services |
10.1 |
9.5 |
10.4 |
|
Retail & CPG |
8.5 |
9.7 |
8.4 |
|
Telecommunications, Media & Entertainment |
8.4 |
8.4 |
9 |
|
Others |
2.3 |
1.8 |
1.5 |
MANAGEMENT & GOVERNANCE
|
Name |
Designation |
|
Cyrus Mistry |
Chairman |
|
N Chandrasekaran |
Managing Director & CEO |
|
Phiroz A Vandrevala |
Director |
|
Aman Mehta |
Director |
|
Venkatraman Thyagarajan |
Director |
|
Ron Sommer |
Director |
|
Ishaat Hussain |
Director |
|
Vijay Kelkar |
Director |
|
Suprakash Mukhopadhyay |
Company Secretary |
|
Clayton M Christensen |
Director |
|
O P Bhatt |
Director |
|
Aarthi Subramanian |
Director |
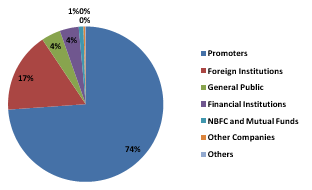
Shareholding pattern as on 30thJune, 2015
|
Category |
No. of Shares |
Percentage |
|
Promoters |
1,446,755,110 |
73.86 |
|
Foreign Institutions |
327,472,033 |
16.72 |
|
General Public |
78,544,268 |
4.01 |
|
Financial Institutions |
77,192,004 |
3.94 |
|
NBFC and Mutual Funds |
19,320,579 |
0.99 |
|
Other Companies |
7,053,903 |
0.36 |
|
Others |
1,871,257 |
0.1 |
|
Central Government |
518,797 |
0.03 |
|
Foreign - OCB |
28 |
0 |
Top funds like UTI, SBI MF, AXIS, HDFC, L&T, Franklin Templeton, J P Morgan have increased their stake in TCS over years which indicate positive demand for the stock.
|
Funds |
Market Value |
No of Shares |
|
UTI Mutual Fund |
1094.6963 |
4269404 |
|
SBI Mutual Fund |
546.5259 |
2130537 |
|
AXIS Mutual Fund |
526.4793 |
2053311 |
|
HDFC Mutual Fund |
391.7968 |
1528018 |
|
DSP BlackRock Mutual Fund |
391.0487 |
1525121 |
|
Birla Sun Life Mutual Fund |
371.2903 |
1448062 |
|
Franklin Templeton Mutual Fund |
313.8495 |
1224038 |
|
Motilal Oswal Mutual Fund |
230.4511 |
898778 |
|
JM Financial Mutual Fund |
228.5465 |
887409 |
|
L&T Mutual Fund |
167.1401 |
651859 |
Company stats at glance
|
Sales |
76213.41 |
|
|
|
Adj.NP |
22276.21 |
EPS(Adjusted) |
85.08 |
|
Equity |
195.87 |
P/E |
30.42 |
|
Market Capitalization |
506852.81 |
EPS(TTM) |
113.73 |
|
Book Value |
231.87 |
P/E(TTM) |
22.75 |
|
Dividend Yield-% |
3.05 |
EV/EBIDTA |
22.33 |
|
Face Value |
1 |
EV/Sales |
6.44 |
|
Enterprise Value |
490623.16 |
P/BV |
11.16 |
INDUSTRY OUTLOOK
Enterprise software is in the midst of a revolution. Today, everyone's a power user. 2014 was all about the “consumerization” of enterprise software -- software companies redefining the user experience to make technology more closely resemble consumer applications. This will continue in this year as developers move away from a purely utilitarian approach to creating software that’s more intuitive, more user-friendly and able to cater to users’ changing needs.
TRENDS IN DEMAND ENVIRONMENT Enterprise Software
-
Gartner estimate the $310bn spend in 2015 growing to $396bn in 2019
-
IT Services – Applications Services (Implementation) worth $158bn in 2015, growing to $177bn in 2019
-
Digitalization – $170bn market growth from 2014-2019. $36bn in digital consulting and implementation, $13bn in digital consulting
-
Increased investment – CEOs intend to raise investment in IT and Digital Capabilities more than any other aspect of their business in 2015.
Increase in global technology spending and opportunities created through adoption of disruptive technologies are expected to propel growth in FY2015. NASSCOM expects the industry to clock export revenues of USD 84-87 billion maintaining a growth rate of 12-14 percent. Domestic revenues will also grow at a rate of 13-15 percent and are expected to reach INR 1180-1200 bn.
INVESTMENT RATIONALE
Well diversified client across geography.
Tata Consultancy Services (TCS) maintained positive demand commentary and stated that its digital business is growing in double digits QoQ. Based on TCS’ guidance of 60,000 addition and 14% attrition assumption for FY16 we estimate net employee addition at approximately 5% and revenue growth of 11%. This reiterates our thesis that the sector will clock higher earnings growth than revenue growth led by productivity gains.
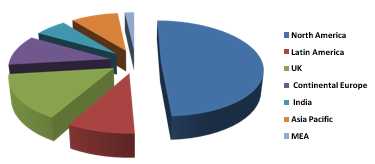
Growth by Market
|
North America |
52.80% |
|
Latin America |
9.60% |
|
UK |
16.10% |
|
Continental Europe |
11.00% |
|
India |
6.40% |
|
Asia Pacific |
9.60% |
|
MEA |
1.90% |
|
Geography |
Q1 FY15 |
Q4 FY15 |
Q1 FY16 |
QoQ GROWTH |
Yoy GROWTH |
|
Americas |
|||||
|
North America |
52.2 |
52.4 |
52.8 |
4.4 |
11.4 |
|
Latin America |
2.2 |
2.1 |
1.9 |
-5.1 |
5.4 |
|
Europe |
|||||
|
UK |
7.7 |
15.9 |
16.1 |
2.8 |
8.5 |
|
Continental Europe |
12 |
11.1 |
11 |
2.2 |
19 |
|
|
|||||
|
India |
6.3 |
6.6 |
6.4 |
2.6 |
15.9 |
|
Asia Pacific |
7.6 |
9.8 |
9.6 |
2.6 |
58 |
|
MEA |
2 |
2.1 |
2.2 |
8.1 |
25.3 |
|
|
|||||
|
Total |
100 |
100 |
100 |
3.5 |
15.8 |
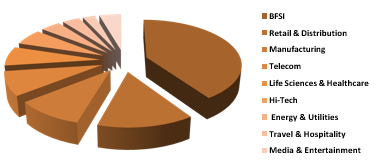
Growth by Domain
|
BFSI |
40.60% |
|
Retail & Distribution |
13.80% |
|
Manufacturing |
9.90% |
|
Telecom |
8.60% |
|
Life Sciences & Healthcare |
6.90% |
|
Hi-Tech |
5.80% |
|
Energy & Utilities |
4.00% |
|
Travel & Hospitality |
3.50% |
|
Media & Entertainment |
2.50% |
|
Others |
4.40% |
|
IP Revenue (%) |
Q1FY15 |
Q4FY15 |
Q1FY16 |
Q-o-Q CCGrowth |
Y-o-Y CCGrowth |
|
BFSI |
41.7 |
40.6 |
40.6 |
3.3 |
12.4 |
|
Retail & Distribution |
13.8 |
13.6 |
13.8 |
5.1 |
15.5 |
|
Manufacturing |
8.6 |
10.2 |
9.9 |
0.3 |
36 |
|
Telecom |
9.4 |
8.8 |
8.6 |
9.6 |
8.2 |
|
Life Sciences & Healthcare |
6.3 |
6.7 |
6.9 |
7 |
21.8 |
|
Hi-Tech |
5.5 |
6 |
5.8 |
2.3 |
21.3 |
|
Energy & Utilities |
3.9 |
3.9 |
4 |
5.5 |
22.2 |
|
Travel & Hospitality |
3.6 |
3.4 |
3.5 |
6.1 |
16.7 |
|
Media & Entertainment |
2.7 |
2.7 |
2.5 |
-6.7 |
0.9 |
|
Others |
4.5 |
4.8 |
4.4 |
-4.2 |
13.7 |
|
Total |
100 |
100 |
100 |
3.5 |
15.8 |
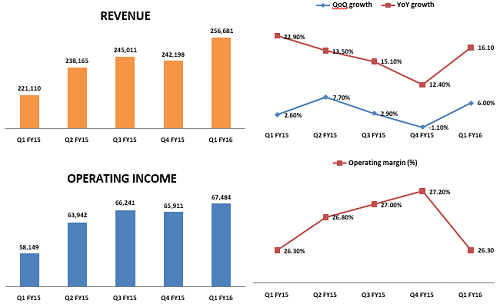
EBIT margin at 29.3% surpassed street’s estimate. BFSI, retail, telecom and life sciences posted robust growth, but manufacturing was flattish due to softness in Latin America and Japan. Rebound in Telecom in‐line with April commentary. The extent was a positive surprise which was mainly due to the distributed footprint between EM and Major market.
Positive thing is it has no direct exposure in Greece and not seeing any impact of Greek problems on Continental Europe.
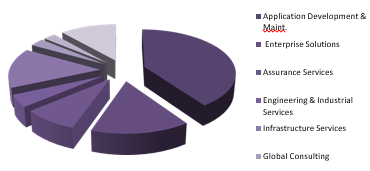
Growth by Service Line
|
Application Development & Maint. |
40.30% |
|
Enterprise Solutions |
15.10% |
|
Assurance Services |
8.50% |
|
Engineering & Industrial Services |
4.50% |
|
Infrastructure Services |
14.70% |
|
Global Consulting |
2.90% |
|
Asset Leveraged Solutions |
2.50% |
|
Business Process Services |
11.50% |
|
|
Q1 FY15 |
Q4 FY15 |
Q1 FY16 |
Q-o-Q CC Growth |
Y-o-Y CC Growth |
|
IT Solutions and Services |
|
||||
|
Application Development & Maint. |
40.8 |
40.1 |
40.3 |
4.1 |
14.2 |
|
Enterprise Solutions |
15.9 |
15.4 |
15.1 |
1.3 |
9.8 |
|
Assurance Services |
8.6 |
8.4 |
8.5 |
3.8 |
12.7 |
|
Engineering & Industrial Services |
4.5 |
4.5 |
4.5 |
2.7 |
12.7 |
|
Infrastructure Services |
12.6 |
14.5 |
14.7 |
5.1 |
36 |
|
Global Consulting |
3.2 |
3.2 |
2.9 |
-7.7 |
6.3 |
|
Asset Leveraged Solutions |
2.5 |
2.3 |
2.5 |
17.7 |
22.2 |
|
Business Process Services |
11.9 |
11.6 |
11.5 |
2.4 |
12.8 |
|
Total |
100 |
100 |
100 |
3.5 |
15.8 |
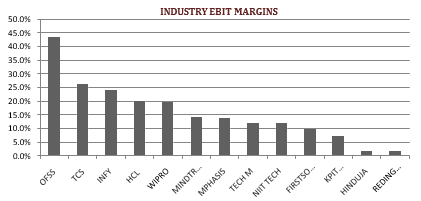
Margins and ratios expected to improve
Tata Consultancy Services (TCS) maintained positive demand commentary and stated that its digital business is growing in double digits QoQ. Based on TCS’ guidance of 60,000 addition and 14% attrition assumption for FY16 we estimate net employee addition at approximately 5% and revenue growth of 11%. This reiterates our thesis that the sector will clock higher earnings growth than revenue growth led by productivity gains.
|
|
Infosys |
Wipro |
HCL Tech |
Tech M |
MphasiS |
TCS |
|
LTP |
1160.45 |
597.15 |
982.15 |
558.05 |
409.4 |
2587.7 |
|
(in Cr.) |
201503 |
201503 |
201406 |
201503 |
201503 |
201503 |
|
View in (Million) |
|
|
|
|
|
|
|
Sales |
53319 |
46951 |
32143.66 |
22621.3 |
5794.81 |
94648.41 |
|
PAT |
12373 |
8714 |
6507.76 |
2658.6 |
674.64 |
20059.7 |
|
Equity |
572 |
493.7 |
140 |
480.4 |
210.15 |
195.87 |
|
OPM % |
34.35 |
27.15 |
27.11 |
18.83 |
18.36 |
29.79 |
|
NPM % |
23.21 |
18.56 |
20.25 |
11.75 |
11.64 |
21.19 |
|
EPS |
99.12 |
32.9 |
91.35 |
26.44 |
28.85 |
88.96 |
|
PE |
20.57 |
17.79 |
16.1 |
22.75 |
11.91 |
24.87 |
|
P/BV |
5.02 |
4.18 |
5.36 |
4.94 |
1.47 |
9.85 |
|
P/EPS |
19.01 |
15.76 |
14.57 |
18.67 |
10.4 |
23.04 |
|
BV |
443.5 |
150.26 |
279.17 |
127.48 |
260.76 |
258.51 |
We believe the company can improve its utilization rate due to rising automation and non‐linearity, scope for it here onwards will be gradual and slow, which caps positive margin surprises going forward.
Domestic business to focus more on profitability
During the year under review, the company has increased number of sizable customers for products and services business. It has also won multi-year contracts for infrastructure Managed services from its clients. The company has consolidated its position in the Indian market and attained top position in most of the business lines in which it is dealing. Company’s strategy for the current financial year is to add and retain more customers and provide more value added services to them. It is also planning to add more value added products to its portfolio which can generate higher returns.
Tata Consultancy Services (TCS) strategy of addressing select enterprise class clients paid rich premium. Its relationship with enterprise clients have become deeper and have extended the engagements in multiple technology and service offerings. A notable client win in the non-ERP services is a large travel house where the company is developing an end-to-end solution to meet their business needs.
|
Clients Contribution |
Q1 FY15 |
Q4 FY15 |
Q1 FY16 |
|
US$ 1m+ Clients |
724 |
791 |
804 |
|
US$ 5m+ Clients |
359 |
389 |
391 |
|
US$ 10m+ Clients |
244 |
261 |
268 |
|
US$ 20m+ Clients |
144 |
162 |
172 |
|
US$ 50m+ Clients |
58 |
68 |
69 |
|
US$ 100m+ Clients |
24 |
29 |
30 |
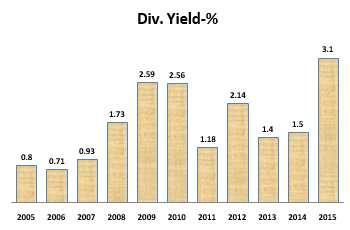
Consistent Dividend History
One of the advantages to shareholders in the respect of stock dividends is the tax benefit. The receipt of the stock dividends by the shareholder is not taxable as income. The payment of stock dividend is normally interpreted by shareholders as an indication of higher profitability.
In the present unpredictable market conditions, picking stocks with high dividend yields is a good strategy for those who are here to invest with a long-term goal as such stocks gives investors fairly regular dividends, plus the capital appreciation could also be fairly good.
|
Year |
Ratio |
Book Value -Unit Curr |
|
2009 |
1:01 |
136.38 |
|
2006 |
1:01 |
114.64 |
|
Year End |
Dividend-Amount(Cr) |
Dividend-% |
Div. Yield-% |
|
201503 |
15473.87 |
7900 |
3.1 |
|
201403 |
6267.33 |
3200 |
1.5 |
|
201303 |
4305.88 |
2200 |
1.4 |
|
201203 |
4893.04 |
2500 |
2.14 |
|
201103 |
2740.1 |
1400 |
1.18 |
|
201003 |
3914.43 |
2000 |
2.56 |
|
200903 |
1370.05 |
1400 |
2.59 |
|
200803 |
1370.05 |
1400 |
1.73 |
|
200703 |
1125.39 |
1300 |
0.93 |
|
200603 |
660.56 |
1350 |
0.71 |
|
200503 |
552.13 |
1150 |
0.8 |
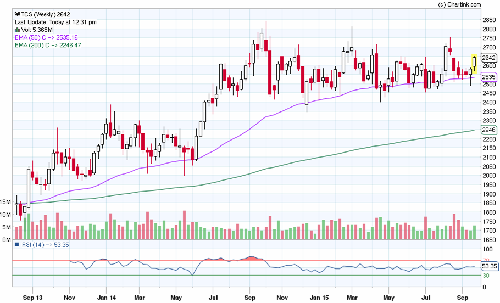
VALUATION
Tata Consultancy Services (TCS) is currently trading at 2588.5 per share with a market capitalization of 506852.81 Cr. It has total debt of 1122.89 Cr with long term Debt to Equity of 0.01. Most of the debt is used for working capital. It has total cash and bank balance of 18556.04 Cr making debt to cash ratio of 0.06.
|
Key Ratios |
201403 |
201503 |
|
Debt-Equity Ratio |
0 |
0 |
|
Long Term Debt-Equity Ratio |
0 |
0 |
|
Current Ratio |
2.59 |
2.54 |
|
|
||
|
Interest Cover Ratio |
1006.74 |
309.53 |
|
EBIDTA M (%) |
38.11 |
35.37 |
|
EBIT M (%) |
36.44 |
33.47 |
|
PATM (%) |
28.57 |
26.17 |
|
ROCE (%) |
60.13 |
53.73 |
|
RONW (%) |
48.22 |
43.05 |
|
Payout (%) |
35.49 |
92.85 |
We value TCS using DCF at price target of 2773 for FY16 with expected growth rate at 13.36% per annum. Comparative analysis also shows it is trading cheep with some of its peers.
For valuation we assume that over the period company will keep capital structure unaltered and tax rate unchanged.
|
|
TCS |
AVERAGE |
|
OPM % |
29.79 |
25.16 |
|
NPM % |
21.19 |
17.082 |
|
EPS |
88.96 |
55.732 |
|
PE |
24.87 |
17.824 |
|
P/BV |
9.85 |
4.194 |
|
P/EPS |
23.04 |
15.682 |
|
BV |
258.51 |
252.234 |
CONCUSSION AND RECOMMENDATION
With Superior project management skills, focus on measuring and monitoring quality and its planned expansion TCS Technologies will be able to grow over the next few years. We recommend BUY on the stock at CMP of Rs. 2588 to target of Rs. 2773 (115x FY16 EPS).
RISKS AND CONCERNS
-
TCS, by ideals of vicinity in various geologies and verticals, is skating in a dangerous situation, wherein a miss from any vertical/topography/administration is sufficient to imprint the development rate.
-
TCS deals in the world-wide market. The different market dynamics have a slight bearing on the operations of the company. The Gains of TCS Technologies is significantly interlinked with the growth of the Banking Industry all over the Globe.
-
Increase in competition and pressure on pricing
As competition increases, acquiring and retaining customers would be challenging. In a highly competitive environment, customers have tough expectations on pricing.
-
The rapidly developing markets and the Competition in the market is a major concern for TCS
FINANCIALS
Tata Consultancy Services Ltd., incorporated in the year 1995, is a Large Cap company (having a market cap of Rs 506860.04 Cr.) operating in Information Technology sector.
For the quarter ended 30-Jun-2015, the company has reported Standalone sales of Rs. 20073.78 Cr., up 6.79% from last quarter Sales of Rs. 18798.23 Cr. and up 15.11% from last year same quarter Sales of Rs. 17438.43 Cr. Company has reported net profit after tax of Rs. 5488.97 Cr. in latest quarter.
|
|
201303 |
201403 |
201503 |
201606 |
201706 |
201806 |
|
Net Sales |
62989.48 |
81809.36 |
94648.41 |
107293.44 |
121627.84 |
137877.32 |
|
Other Income |
1178.23 |
1636.74 |
3719.66 |
2150.00 |
2150.00 |
2150.00 |
|
Total Income |
64167.71 |
83446.1 |
98368.07 |
109443.44 |
123777.84 |
140027.32 |
|
Total Expenditure |
44949.57 |
56656.57 |
70166.7 |
78066.84 |
88291.68 |
99882.56 |
|
EBIDTA |
19218.14 |
26789.53 |
28201.37 |
30760.20 |
34869.77 |
39528.37 |
|
Interest |
48.49 |
38.52 |
104.19 |
115.92 |
131.10 |
148.31 |
|
Depreciation |
1079.92 |
1349.15 |
1798.69 |
1961.89 |
2224.00 |
2521.13 |
|
EBIT |
18138.22 |
25440.38 |
26402.68 |
28798.31 |
32645.77 |
37007.24 |
|
PBT |
18089.73 |
25401.86 |
26298.49 |
29298.78 |
33131.05 |
37475.31 |
|
Tax |
4014.04 |
6069.99 |
6238.79 |
6592.23 |
7454.49 |
8431.95 |
|
Reported Profit After Tax |
14075.69 |
19331.87 |
20059.7 |
22706.55 |
25676.56 |
29043.37 |
|
Minority Interest After NP |
158.38 |
168 |
207.52 |
230.88 |
261.13 |
295.41 |
|
Adjusted PAT |
13917.31 |
19163.87 |
21874.16 |
22475.67 |
25415.44 |
28747.96 |
|
|
|
|||||
|
Equity |
195.72 |
195.87 |
195.87 |
195.87 |
195.87 |
195.87 |
|
EPS (Adj) (Unit Curr.) |
70.99 |
97.67 |
101.35 |
114.75 |
129.75 |
146.77 |
|
EBIDTA Margin |
30.51% |
32.75% |
29.80% |
28.67% |
28.28% |
29.75% |
|
EBIT Margin |
28.80% |
31.10% |
27.90% |
26.84% |
27.86% |
28.69% |
|
PAT Margin |
21.69% |
22.97% |
22.24% |
20.54% |
21.32% |
21.35% |
- Share :


Post a Comment
|
DISCLAIMER |
This report is only for the information of our customers. Recommendations, opinions, or suggestions are given with the understanding that readers acting on this information assume all risks involved. The information provided herein is not to be construed as an offer to buy or sell securities of any kind. ATS and/or its group companies do not as assume any responsibility or liability resulting from the use of such information.