Supreme Industries
Supreme Industries Limited - Background
The Supreme Industries Limited is engaged in production of plastic products. The Company operates in two segments: Plastics and Construction. The Company offers a wide range of plastic products with a variety of applications in Molded Furniture, Storage and Material Handling Products, XF Films and products, Performance Films, Industrial Molded Products, Protective Packaging Products, Plastic Piping System, Composite LPG Cylinder and Petrochemicals. The Company handles a volume of over 2,85,000 tons of polymers annually. The Company has over 29 production plants. The Company’s products include molded furniture, material handling products, petrochemicals F films and products (SILPAULIN), performance films, industrial molded products, protective packaging products, plastic piping system and bathroom fittings. Source: Reuters
Key Parameters
|
BSE Code |
509930 |
|
NSE Code |
SUPREMEIND |
|
Reuters Code |
SUPI.NS |
|
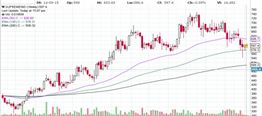
CMP (as on 15/09/2015) |
590.00 |
|
Stock Beta |
0.29 |
|
52 Week H/L |
745/540 |
|
Market Cap (Cr) |
7570.80 |
|
Equity Capital (Rs cr) |
25.41 |
|
Face Value (Rs) |
2 |
|
Average Volume |
62326 |
|
|
|
|
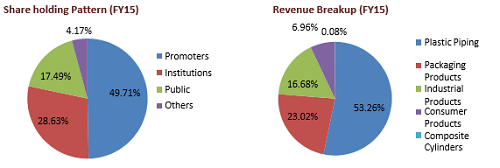
Shareholding Pattern (%) |
|
|
Promoters |
49.71 |
|
Non Institutions |
50.29 |
|
Grand Total |
100 |
Supreme Industries Limited - Investment Rationale
-
Significant market share
-
Aggressive capex plans
-
Consistent growth and sound financials
-
Increase in replacement demand
-
New product launches and value added products
Supreme Industries Limited - Risks and Concerns
-
Competition from unorganized sector
-
Dependence on end user industry
-
Cost fluctuations
Conclusion & Recommendation
Supreme Industries Limited being a dominant player in domestic and international plastic and packaging market with its high quality products and wise market reach in both India and abroad. With aggressive capex plans, debt reduction and growth opportunities we expect company to outperform the industry in the both medium term and long term future.
At the current market price of Rs.590 the stock is trading at ~30x FY17E EPS. Investors could buy the stock at CMP and add on dips to around Rs.528 to Rs.540 levels (~27x FY17E EPS) for our sequential targets of Rs.698 and Rs.745 (~35x to ~37x FY17E EPS).
Supreme Industries Limited - Financial Summary
|
Particulars (Rs. in Crs) |
FY2013 |
FY2014 |
FY2015 |
2016E(#9) |
2017E |
|
Net Sales |
3359.03 |
3905.16 |
4219.48 |
3670.95 |
5775.62 |
|
Operating Profit |
535.47 |
592.02 |
668.67 |
586.36 |
913.60 |
|
PAT |
268.42 |
274.35 |
311.71 |
315.17 |
503.66 |
|
EPS (Rs.) |
10.56 |
10.80 |
12.27 |
12.40 |
19.82 |
|
PE (x) |
56.42 |
55.20 |
48.56 |
48.05 |
30.07 |
Supreme Industries Limited - Business Profile
Product Profile
|
Moulded Furniture |
The Protective Packaging Division |
|
XF Films & Products |
Petrochemical |
|
Bathroom Fittings |
Composite Cylinder |
|
Plastic Piping System |
Performance Films |
|
Material Handling Products |
Industrial Products Division |
Manufacturing facilities
The Company is in the process of setting up two units. viz one at Kharagpur in West Bengal and the other one at Malanpur near Gwalior in Madhya Pradesh. The Company hopes that both units will be in production by September 2015. The Company will then have, 25 manufacturing units spread throughout the country. This enables the Company to reach its products to the market at shortest possible time with least freight cost. Kharagpur Unit will produce PVC, PE Pipes, Protective Packaging Products and new category of Plastics Furniture and varieties of Roto Moulded products. Due to several local issues, startup of plant at this site has been delayed. Malanpur Unit is going to produce varieties of Roto moulded products.
Distribution network
Your Company is committed to increase its reach by adding more channel partners in several parts of the country. The Company has increased its channel partners from 2257 Nos. as on 30th June 2014 to 2469 Nos. as on 30th June 2015. Distributors are the strength of the Company. Your Company enjoys good rapport and loyalty from its distributor network. The distributors are working assiduously to distribute Company’s products in their respective regions in a very efficient way.
Investment Rationales
Significant market share
SIL have a market share of 14 percent in domestic plastic piping market, 13 percent in industrial products and 10 percent in plastic moulded furniture, where it is also the 2nd largest player in India with a processing capacity of 4.5 lakh tonnes annually. This comprises 54,700tn of industrial products, 28,000tn of consumer products, 311,000tn of plastic pipe and fittings and 60,000tn of packaging products. Having a significant market share for its products with more than 9000 products under different verticals in the market helps the company to reduce the bargaining power of the customers. SIL is having a wide product range in its portfolio with more than a dozen products launches lined up in the coming months, company will be able to tap in market demand for the various needs and requirements of the customers. SIL has excellent distribution channels consist of more than 2,000 channel partners and ~25,000 retail counters. It has ~700 channel partners in plastic piping and ~180 distributors in packaging segment.
Aggressive capex plans
SIL have CAPEX plans to expand its domestic manufacturing foot print to ~30% by 2017-18, leading to expansion of its capacity to 7,00,000mt from existing 4,50,000mt which is in line with the forecasted demand for its new products categories.SIL targets to achieve a turnover of Rs.80,00 cr from the present Rs.4219 cr by FY2017-18 . Capex plans will help the company to tap the market demand and growth potential of both domestic and international markets. The increase in manufacturing capacity will help the company not only to increase the production of current product portfolio but also to make new products in various product segments and upgrade the technology used in the plants.
Consistent growth and sound financials
Supreme Industries Limited (SIL) is having a balance sheet is backed by strong working capital management. The current Debt-to-equity ratio is 0.32 and FY11 is 0.94 with a dividend payout ratio for FY15 is 35.4 percent. The company has a strong return on capital employed (RoCE) stands at 28 percent between FY11-FY15 and return on equity (RoE) at 32 percent for the same period. The five year revenue CAGR but five year revenue CAGR has been ~16%, in which FY15 Rs 4,255 crore Profit CAGR: The profit CAGR for the last five years is 15 percent and since it does use crude derivatives in into its products there is an expectation that the profit CAGR could improve further as their margins improve hereon. Average Net Profit of the company for last 3 financial years Rs. 394.08 crores
New product launches and Value added products
Company is trying to focus more on high margin Value added Products (VAP) Company classifies its products as a VAP, where the operating margins are higher than 17%. As a conscious effort, SI continues to specialize in high margin value added products that give an edge over its competitors. The management expects the revenue share of VAP to further increase to 35% by FY16. The expansion in VAP revenue share would largely come from moulded furniture segment and protective packaging segment. In the moulded furniture segment, the company plans to increase the VAP revenue share from 36.3% in FY12 to 80% by FY16 and in the protective packaging segment, VAP share is planned to increase from 36% in FY12 to 45% in FY16. The company will increase the VAP revenue share in these segments, mostly by exiting from the commoditized products, where the competition from unorganized sector is high. With the increase in VAP share in total revenue will further increase the profit margins of the company. SIL’s entry into composite LPG cylinders and manufacturing cross - laminated films (XF) are its strategy to expand the overall VAP share to 35% by FY16. Company has the exclusive rights to manufacture and market the XF films in India, Africa, South Asia and East Asia (barring Mongolia). SIL has secured approval from Korea Gas Safety Corporation for another two sizes - 12.5 litre and 30.5 litre – of its composite cylinders, which will further add companies global footprint and will act as stimulus to the company’s efforts towards increasing its revenue from exports.
Growth prospects of the economy
Plastic demand linked to GDP growth for every 1% growth in GDP, it is expected that the demand for plastic would increase by 2 to 2.5 times. Yet, Indian plastic consumption is lowest in the world and constitutes one fifth of the world average. India being a growing economy with rapid urbanization and thriving consumer market, needs to invest more in infrastructure and housing going forward. So higher investment in power, housing, water supply and irrigation are necessary to meet the needs of a growing India is a huge positive for plastic piping industry. Apart from this, demand for housing infrastructure is driving distribution demand for industrial goods, cement and paints and varnishes etc which ultimately is a big growth driver for the packaging segment too. Higher demands from a young and growing population and quicker acceptance to new age consumers are driving the demand for quality packaging for various necessities like food grains, vegetables, milk & health drinks, carbonated drinks and water distributions. Moreover, the awareness of hygiene, beautification and skin care will also become growth driver in time to come.
Increase in replacement demand
The conventional products are making way to new innovative low cost and efficient products. For example GI pipes (conventional steel pipes) are replaced by plastic pipes as it is cost effective, flexible, and free from corrosion and readily replaceable, which is likely to increase the replacement demand in India. Along with associated increase in demand for housing, water supply and irrigation, new demand for plastic piping would increase. Company also plans to make to launch new products using high end technology with high quality and efficiency to capitalize on the replacement market.
Effective business model and debt reduction
Supreme Industries Limited (SIL) have its manufacturing facilities spread across India which produces its wide range of products. Having manufacturing facilities helps the company to reduce its logistics expenses to the minimum and its also helps the company to reduce its operating expenses. Working capital cycle of the company is 72 days and cash conversion cycle is 27 days which will allow the company to have quick cash flow. The decrease in crude oil derivatives, which is key raw material for the production will further decrease the raw material cost of the company. Company has reduced its debt liabilities considerably and current debt stands at RS.328 crore. SIL have build in area of ~60000 sq ft which is planned to be sold for further debt reduction and the remaining fund is used for the expansion and modernization plans.
Subsidiaries and Joint Ventures
Supreme Petrochem Ltd (SPL), is jointly promoted by Supreme and the Ranjan Raheja Group. SIL holds 29.88% stake in SPL, which manufactures various grades of polystyrene. It has an installed capacity of ~2,72,000 tonnes across two plants - one in Nagothane (Raigad, Maharashtra) and one in Chennai (Tamilnadu). With ~60% market share, SPL is the leader in the domestic polystyrene market. The company exports to over 80 countries and is the largest Indian exporter of polystyrene exports account for ~20% of sales. Subsidiary Company Supreme Industries overseas FZE, sharjah, UAE, is a wholly owned subsidiary with its foot prints in GCC countries, Africa, Australia, UK, Germany and Indian sub-continent. The major activity of this subsidiary is to promote plastic pipes of SIL globally. Improvement in performance and growth of the subsidiary will further add to the revenue and profits of the company.
Governmental initiatives
Governmental initiatives such as “Make in India”, “Affordable Housing”, etc will act as a supplement towards the growth of the company to a significant expend. As it increases the demand for the various plastic related products which is related to real estate, construction, automobiles, etc. Implementation of GST will further trigger the growth of the company and packaging product in particular as it relaxes the Tax implications in the country in a significant manner. With the growth of the client companies which include M&M, Maruti Suzuki, Tata Motors, Ashok Leyland, Denso, Exide, Kinetic Eng, Piaggio, Hitachi, Panasonic, Samsung, Tata chemicals, Videocon, Whirlpool, Daikin, Coca cola, Reliance retail, Pepsi co, HUL, etc, will help to increase the revenue of the company. Having a well diversified product portfolio helps the company to tap in demand for the various industries.
Industry Overview
The Indian plastics industry made a promising beginning in 1957 with the production of polystyrene. Thereafter, significant progress has been made, and the industry has grown and diversified rapidly. The industry spans the country and hosts more than 2,000 exporters. It employs about 4 million people and comprises more than 30,000 processing units, 85-90 per cent of which are small and medium-sized enterprises.
India is one of the most promising exporters of plastics among developing countries. The plastics industry produces and exports a wide range of raw materials, plastic-moulded extruded goods, polyester films, laminates, moulded or soft luggage items, writing instruments, plastic woven sacks and bags, polyvinyl chloride (PVC), leather cloth and sheeting, packaging, consumer goods, sanitary fittings, electrical accessories, laboratory/medical surgical ware, tarpaulins, laminates, fishnets, travel ware, and others.
Demand from original equipment manufacturers (OEMs) has led to producers focusing more on delivering products customised in line with end-user needs. Moreover, the Indian plastics industry has started manufacturing specific items to meet customer requirements. Design, style, and pattern are set based on the requirements of customers in export markets.
The Indian plastics industry offers excellent potential in terms of capacity, infrastructure and cheap labour availability. It is supported by a large number of polymer producers, and plastic process machinery and mould manufacturers in the country. Among the industry’s major strengths is the availability of raw materials in the country. Thus, plastic processors do not have to depend on imports. These raw materials, including polypropylene, high-density polyethylene, low-density polyethylene and PVC, are manufactured domestically.
Plastic material is gaining notable importance in different spheres of activity and the per capita consumption is increasing at a fast pace. Continuous advancements and developments in Plastic technology, processing machineries, expertise, and cost effective manufacturing is fast replacing the typical materials. On the basis of value added share, the Indian Plastic industry is about 0.5% of India's GDP. The export of plastic products also yields about 1% of the country's exports. The sector has a large presence of small scale companies in the industry, which account for more than 50% turnover of the industry and provides employment to an estimated 0.4 million people in the country. Approximately Rs.100 billion is invested in the form of fixed assets in the plastic processing industry.
Typically, in an emerging market, demand growth for plastics is 2 to 2.5 times the GDP growth. Sadly this is not the case in India where the growth at times has been lower than the GDP growth. The per capita consumption of plastics in India at 5kg is much lower than that of China which averages 25kg. But India could see very soon improvement in the production of Plastic. India today represents range of highly promising opportunities for growth of plastics producers worldwide. The fragmented plastics industry in India is beginning to consolidate, governmental regulations and trade barriers are coming down due to India's recent admission to the WTO, and some large North American plastics manufacturers have already begun doing business here.
The Indian Plastic industry is at the verge of high growth rate over about 10%-12% which is contributed by high growth rates, in turn, from the end-user industries. This trend has mainly been driving the automotive sector, since the economy is already showing signs of recovery from the downturn. As the Plastic industry is heavily dependent on real estate, packaging and automotive sector, launching of new cars in the small segments are expected to drive the demand for plastics.
Role of plastic industry in Indian economy
|
|
2005 |
2015 |
|
15% CAGR, consumption of plastic polymers |
4.7 million tonnes |
18.9 million tonnes |
|
Employment in plastic industry (direct and indirect) |
2.5 million |
9.5 millions |
|
Plastic industry turnover |
Rs.35000 crs |
Rs.133245 cr |
|
Export of plastic products @ 30 CAGR |
US $ 1900 millions |
US $ 10215 millions |
|
Contribution of polymers and plastic products to the exchequer |
Rs.6200 crs |
Rs.15990 crs |
Risks and Concerns
Competition from unorganized sector
There are large number unorganized players in plastic piping and packaging industry delivering products at different standards. SIL is exposed to high completion from these players both in domestic and international markets.
Dependence on end user industry
SILs majority revenue comes from selling its products to the various end user industries. So the SIL’s performance over dependant on end user industries demands.
Cost fluctuations
Cost of raw materials contributes a significant share in the cost of production for SIL products and rupee depreciation would increase cost of imports, which in turn, could affect profitability.
Financials
Quarterly financial review
-
Supreme Industries has reported a consolidated total income from operations of Rs 1,278.05 crore and a net profit of Rs 159.80 crore for the quarter ended Jun '15.
-
For the quarter ended Jun 2014 the consolidated total income from operations was Rs 1,277.30 crore and net profit was Rs 119.44 crore.
-
Supreme Ind shares closed at 640.55 on July 23, 2015 (NSE) and have given 9.61% returns over the last 6 months and 2.98% over the previous 12 months.
Q1FY16
|
|
4th Qtr 201506 |
4th Qtr 201406 |
VAR [%] |
4th Qtr 201506 |
3rd Qtr 201503 |
VAR [%] |
|
Gross Sales |
1270.24 |
1256.17 |
1.1 |
1270.24 |
1143.67 |
11.1 |
|
Excise Duty |
0 |
0 |
0 |
0 |
0 |
0 |
|
Net Sales |
1270.24 |
1256.17 |
1.1 |
1270.24 |
1143.67 |
11.1 |
|
Other Operating Income |
7.71 |
20.86 |
-63 |
7.71 |
8.03 |
-4.0 |
|
Other Income |
0.93 |
1.03 |
-9.7 |
0.93 |
0.03 |
3000.0 |
|
Total Income |
1278.88 |
1278.06 |
0.1 |
1278.88 |
1151.73 |
11.0 |
|
Total Expenditure |
1020.15 |
1054.91 |
-3.3 |
1020.15 |
953.59 |
7.0 |
|
PBIDT |
258.73 |
223.14 |
15.9 |
258.73 |
198.14 |
30.6 |
|
Interest |
10.94 |
17.42 |
-37.2 |
10.94 |
16.24 |
-32.6 |
|
PBDT |
247.79 |
205.72 |
20.5 |
247.79 |
181.9 |
36.2 |
|
Depreciation |
35.53 |
27.48 |
29.3 |
35.53 |
35.26 |
0.8 |
|
PBT |
212.26 |
178.24 |
19.1 |
212.26 |
146.64 |
44.7 |
|
Tax |
89.17 |
35.17 |
153.5 |
89.17 |
50.55 |
76.4 |
|
Fringe Benefit Tax |
0 |
0 |
0 |
0 |
0 |
0 |
|
Deferred Tax |
-17.63 |
26.1 |
-167.5 |
-17.63 |
0 |
0 |
|
Reported Profit After Tax |
140.72 |
116.97 |
20.3 |
140.72 |
96.09 |
46.4 |
|
Extra-ordinary Items |
0 |
0 |
0 |
0 |
0 |
0 |
|
Adjusted Profit After Extra-ordinary item |
140.72 |
116.97 |
20.3 |
140.72 |
96.09 |
46.4 |
|
|
|
|
|
|
|
|
|
PBIDTM(%) |
20.37 |
17.76 |
14.7 |
20.37 |
17.32 |
17.6 |
|
PBDTM(%) |
19.51 |
16.38 |
19.1 |
19.51 |
15.9 |
22.7 |
|
PATM(%) |
11.08 |
9.31 |
19 |
11.08 |
8.4 |
31.9 |
Profit and Loss Account as per rough estimates
|
|
FY2013 |
FY2014 |
FY2015 |
2016E(#9) |
2017E |
|
Gross Sales |
3359.03 |
3905.16 |
4219.48 |
3670.95 |
5775.62 |
|
Excise Duty |
0 |
0 |
0 |
0 |
0 |
|
Net Sales |
3359.03 |
3905.16 |
4219.48 |
3670.95 |
5775.62 |
|
Other Income |
-0.16 |
3.21 |
2.43 |
1.08 |
1.90 |
|
Other Operating Income |
44.96 |
57.07 |
35.7 |
36.72 |
48.63 |
|
Total Income |
3403.83 |
3965.44 |
4257.62 |
3708.75 |
5826.16 |
|
Total Expenditure |
2868.36 |
3373.42 |
3588.95 |
3122.39 |
4912.55 |
|
PBIDT |
535.47 |
592.02 |
668.67 |
586.36 |
913.60 |
|
Interest |
52.35 |
76.14 |
57.96 |
43.47 |
63.42 |
|
PBDT |
483.12 |
515.87 |
610.71 |
542.89 |
850.19 |
|
Depreciation |
81.71 |
101.55 |
138.96 |
91.67 |
133.12 |
|
Minority Interest Before NP |
0 |
0 |
0 |
0 |
0 |
|
PBT |
401.41 |
414.33 |
471.75 |
451.22 |
717.07 |
|
Tax |
125.6 |
113.88 |
177.67 |
139.88 |
222.29 |
|
Fringe Benefit Tax |
0 |
0 |
0 |
0 |
0 |
|
Deferred Tax |
7.39 |
26.1 |
-17.63 |
-3.82 |
-8.8812 |
|
Reported Profit After Tax |
268.42 |
274.35 |
311.71 |
315.17 |
503.66 |
|
Minority Interest After NP |
0 |
0 |
0 |
0 |
0 |
|
Profit/Loss of Associate Company |
21.68 |
9.09 |
10.65 |
9.26 |
14.58 |
|
Net Profit after Minority Interest & P/L Asso. Co. |
290.1 |
283.44 |
322.36 |
324.43 |
518.24 |
|
Extra-ordinary Items |
0 |
0 |
0 |
0 |
0 |
|
Adjusted Profit After Extra-ordinary item |
290.1 |
283.44 |
322.36 |
324.4351 |
518.24 |
|
|
|
|
|
|
|
|
PBIDTM(%) |
15.94 |
15.16 |
15.85 |
15.973 |
15.81 |
|
PBDTM(%) |
14.38 |
13.21 |
14.47 |
14.79 |
14.72 |
|
PATM(%) |
7.99 |
7.03 |
7.39 |
8.83 |
8.97 |
Balance Sheet as per rough estimates
|
|
FY2013 |
FY2014 |
FY2015 |
2016E(#9) |
2017E |
|
SOURCES OF FUNDS: |
|
|
|
|
|
|
Share Capital |
25.41 |
25.41 |
25.41 |
25.41 |
25.41 |
|
Reserves & Surplus |
853.58 |
1013.75 |
1186.09 |
1395.52 |
1730.76 |
|
Equity Share Warrants |
0 |
0 |
0 |
0 |
0 |
|
Loan Funds |
408.87 |
384.57 |
328.79 |
271.56 |
130.58 |
|
Deferred Tax Liability |
90.65 |
116.75 |
89.51 |
107.97 |
112.11 |
|
Other Liabilities |
12.99 |
11.14 |
11.51 |
11.422 |
11.25 |
|
Total Liabilities |
1391.5 |
1551.62 |
1641.31 |
1811.89 |
2010.14 |
|
APPLICATION OF FUNDS: |
|
|
|
|
|
|
Fixed Assets |
1060.79 |
1105.99 |
1132.31 |
1270.41 |
1375.49 |
|
Investments |
109.83 |
107.35 |
120.69 |
126.67 |
136.67 |
|
Current Assets, Loans & Advances |
814.01 |
894.87 |
1012.07 |
1107.52 |
1246.39 |
|
Inventories |
466.8 |
497.65 |
464.67 |
544.36 |
595.07 |
|
Sundry Debtors |
203.12 |
234.78 |
237.97 |
270.12 |
293.26 |
|
Cash & Bank Balance |
23.86 |
24.63 |
181.83 |
155.43 |
212.03 |
|
Other Current Assets |
1.71 |
1.6 |
1.38 |
1.064 |
0.56 |
|
Loans & Advances |
118.5 |
136.22 |
126.23 |
136.55 |
145.48 |
|
Current Liabilities & Provisions |
640.86 |
625.06 |
715.71 |
789.00 |
855.52 |
|
Current Liabilities |
533.06 |
521.19 |
558.78 |
622.98 |
666.23 |
|
Provisions |
107.79 |
103.87 |
156.93 |
166.02 |
189.29 |
|
Net Current Assets |
173.15 |
269.81 |
296.36 |
318.52 |
390.87 |
|
Deferred Tax Assets |
0 |
0 |
0 |
0 |
0 |
|
Miscellaneous Expenses not W/Off |
0 |
0 |
0 |
0 |
0 |
|
Other Assets |
47.73 |
68.46 |
91.95 |
96.30 |
107.10 |
|
Total Assets |
1391.5 |
1551.62 |
1641.31 |
1811.89 |
2010.14 |
Conclusion and Recommendation
We are positive on SIL over the long term and hence recommend a BUY at CMP of RS.590.00 and further add on declines between Rs.540 to Rs.528 for a target of Rs.698 to Rs.745 with stop loss maintained at Rs.510.
- Share :


Post a Comment
|
DISCLAIMER |
This report is only for the information of our customers. Recommendations, opinions, or suggestions are given with the understanding that readers acting on this information assume all risks involved. The information provided herein is not to be construed as an offer to buy or sell securities of any kind. ATS and/or its group companies do not as assume any responsibility or liability resulting from the use of such information.