SIEMENS LIMITED
Siemens Limited is an India-based provider of technology enabled solutions in a range of sectors. The Company operates in five business segments: Infrastructure and Cities, Energy, Industry, Healthcare and Others. Infrastructure and Cities provides electrical installation technologies. The Company was incorporated in India on 2nd March 1957, as a private limited company under the name Siemens Engineering and Manufacturing Company of India Private Limited.
Siemens Limited - Key Parameters
|
BSE Code |
500550 |
|
|
NSE Code |
SIEMENS |
|
|
Reuters Code |
SIEM.NS |
|
|
INCEPTION |
MARCH 1957 |
|
|
IPO |
1970 |
|
|
Sector |
INDUSTRIALGOODS |
|
|
CMP (as on 23/10/2015) |
1350 |
|
|
Stock Beta |
1.435 |
|
|
52 Week H/L |
795.50 / 1558 |
|
|
Market Cap (Cr) |
48,607 |
|
|
Equity Capital (Rs cr) |
71.2 |
|
|
Face Value (Rs) |
2.00 |
|
|
Average Volume |
2,89,408 |
|
|
|
||
|
Shareholding Pattern (%) |
||
|
Promoters |
75 |
|
|
Non Institutions |
25 |
|
|
Grand Total |
100 |
|
Potential Catalysts
-
Fiscal Budget impact on Manufacturing and indirectly on SIEM.
-
Make in India
-
Continued Focus on Driving Profitable Growth
Siemens Limited - Recommendation
The emphasis on expense streamlining and confinement ought to help aggressiveness which will help SIEM once the business sector recuperates. We value SIEM using DCF at price target of 1433 for FY16 with expected growth rate at 10.94% per annum. We recommend BUY on the stock at CMP of Rs. 1350 to the above target.
Siemens Limited - Financial Summary
|
Yearly IncomeStatement |
2013 |
2014 |
2015 E |
2016 E |
2017 E |
|
Revenue |
11145.24 |
10448.27 |
10823 |
12007.04 |
13320.61 |
|
Total Income |
11419.62 |
11149.15 |
11665.78 |
12718.31 |
14032.04 |
|
EBIDTA |
487.66 |
1080.84 |
1179.38 |
1105.10 |
1240.26 |
|
EBIT |
237.47 |
851.73 |
946.06 |
844.38 |
945.59 |
|
Adjusted PAT |
165.15 |
329.53 |
419.20 |
344.67 |
384.80 |
|
EBIDTA Margin |
4.38% |
10.34% |
10.90% |
9.20% |
9.31% |
|
EBIT Margin |
2.13% |
8.15% |
8.74% |
7.03% |
7.10% |
|
PAT Margin |
1.45% |
2.96% |
3.59% |
2.71% |
2.74% |
BUSINESS DISCRIPTION
Siemens Limited provides technology-enabled solutions for the infrastructure and cities, energy, industry, and healthcare sectors. It‟s Infrastructure and Cities segment provides electrical installation technologies, such as miniature circuit breakers, distribution boards, residual current circuit breakers, etc.; and rail automation, railway electrification, light and heavy rail, locomotives, trains, and turnkey project solutions, as well as offers solutions for the automation of power grids to products that comprise medium-voltage switchgear and components. Its Energy segment offers power generation products and solutions based on fossil fuels, such as individual gas and steam turbines and generators, and turnkey power plants; products and solutions for the extraction, conversion, and transportation of oil and gas; and solutions for power generation and distribution, including high voltage direct current transmission systems, substations, switchgears, and transformers. It‟s Industry segment offers automation products and systems, industrial automation systems and low voltage switchgears, large and standard drives and motors, special purpose motors, and process and motion control systems; and concept, engineering, procurement, supplies, installation, commissioning, and after sales services for turnkey projects in the industrial and infrastructure sectors. Its Healthcare segment provides diagnostic, therapeutic, and life-saving products in computer tomography, magnetic resonance imaging, ultrasonography, nuclear medicine, digital angiography, patient monitoring systems, digital radiography systems, and radiology networking systems, lithotripsy, and linear accelerators. It was formerly known as Siemens India Limited and changed its name to Siemens Limited in March 1987. Siemens Limited was incorporated in 1957 and is based in Mumbai, India. Siemens Limited is a subsidiary of Siemens AG.
MANAGEMENT & GOVERNANCE
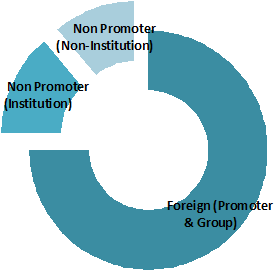
Shareholding pattern as on 30thJune, 2015
|
EQUITY - SHARE HOLDINGPATTERN |
||||||
|
|
No of Shares |
% of Holding |
No of Shares |
% of Holding |
No of Shares |
% of Holding |
|
Description as on |
30-09-2015 |
30-06-2015 |
31-03-2015 |
|||
|
Foreign (Promoter & Group) |
267089913 |
75 |
267089913 |
75 |
267089913 |
75 |
|
Indian (Promoter & Group) |
0 |
0 |
0 |
0 |
0 |
0 |
|
Total of Promoter |
267089913 |
75 |
267089913 |
75 |
267089913 |
75 |
|
Non Promoter (Institution) |
49788693 |
13.98 |
49859081 |
14 |
49690389 |
13.95 |
|
Non Promoter (Non-Institution) |
39241649 |
11.02 |
39171201 |
11 |
39339893 |
11.05 |
|
Total Non Promoter |
89030342 |
25 |
89030282 |
25 |
89030282 |
25 |
|
Total Promoter & Non Promoter |
356120255 |
100 |
356120195 |
100 |
356120195 |
100 |
|
Grand Total |
356120255 |
100 |
356120195 |
100 |
356120195 |
100 |
|
Top Fund Holders |
No of Shares Sept 2015 |
No of Shares Aug2015 |
|
HDFC Mutual Fund |
5333704 |
5167704 |
|
Reliance Mutual Fund |
2743933 |
2802779 |
|
AXIS Mutual Fund |
763219 |
756919 |
|
Tata Mutual Fund |
672400 |
672400 |
|
ICICI Prudential Mutual Fund |
496712 |
496621 |
|
UTI Mutual Fund |
423952 |
423952 |
|
DSP BlackRock Mutual Fund |
330307 |
330307 |
|
Canara Robeco Mutual Fund |
153100 |
138100 |
|
L&T Mutual Fund |
132400 |
168440 |
|
Birla Sun Life Mutual Fund |
98134 |
167634 |
The company‟s management includes Mr.Ketan Thaker, Dr.Roland Busch, Mr.Christian Rummel, Mr.Darius C Shroff, Mr.Deepak S Parekh, Mr.Joe Kaeser, Mr.Johannes Apitzsch, Mr.Keki B Dadiseth, Mr.Pradip V Nayak, Mr.Sunil Mathur, Mr.Yezdi H Malegam, Ms.Mariel von Schumann, Mr.Ketan Thaker.
INDUSTRY OUTLOOK
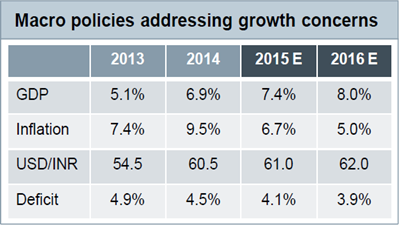
India - macroeconomic environment
Sound policies but implementation is the key. Tough decisions, grounded in economics
-
Budget sets foundation for capacity buildup
-
Govt. will focus its spend on infrastructure
-
Soft commodity prices mainly oil are helping
-
Government spending critical
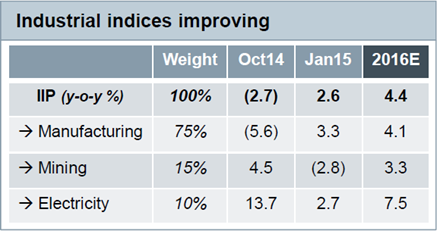
IIP volatile, gradual recovery underway
-
Manufacturing driving IIP in past few months
-
Sustainable growth questionable still
-
Key sectors still missing growth
-
Mining and electricity tapering off
-
Concerns over capacity under-utilization
INVESTMENT RATIONALE
Budget Impact on Siemens Vertical Markets
-
Infrastructure outlay has been increased 1.5 times to Rs. 2800 bn with roads, railways and urban infrastructure the biggest beneficiaries
Siemens impact: Higher spend on infrastructure to generate higher demand for the relevant business divisions e.g. BT, EM, PD
-
In the Railway Budget 2015-16, outlay raised 52% to Rs. 1000bn with PPP projects in coastal connectivity, gauge conversion, dedicated freight corridors (DFCs) and Mumbai suburban rail
Siemens impact: Opportunities in safety, signaling and rolling stock components (traction motors and propulsion systems)
-
Smart City - Investment of Rs. 120 bn in Dholera and Shendra-Bidkin Corridor in DMIC to set up basic infrastructure
Siemens impact: Limited impact on Siemens as major spend (~85%) on smart cities is in construction. However post construction significant opportunities in SG, EA, BT and HC.
-
Power Generation - Set up 5 ultra-mega power plants each of 4,000 MW, with pre awarded clearances/fuel linkages in plug and play mode
Siemens impact: Significant impact if we partner with key EPC players. Revised bidding norms awaited
-
Power T&D - Allocation to transmission & distribution (T&D) segment increased by 26% to Rs. 63.5 bn „Electrification by 2020‟ for the balance 20,000 villages including off-grid Solar Power
Siemens impact: Significant opportunities in EM products and solution.
-
Oil & Gas - Subsidy of Rs. 300 bn implies flat realisation, lower interest cost, improves liquidity for upstream oil companies
Siemens impact: Improved liquidity could trigger investments by upstream oil companies, however lower crude prices may affect Capex.
Make in India
Siemens has 23 factories, 8 Centers of Competence and 11 R&D Centers
-
Strong focus on localization
-
They are pioneers in infrastructure solutions, and automation & software solutions for industry
Smart Cities
-
Siemens is involved in the Restructured Accelerated Power Development and Reforms Programme (R-APDRP) program
-
Siemens has a Centre of Excellence, competencies and portfolio (Energy Efficiency, Traffic Management, T&D, Metros / LRTs, etc.)
Power Generation, Transmission & Distribution, including Smart 24x7 Energy Grids
Skill Development
-
SITRAIN
-
ITI Up gradation
-
Engineering Colleges
-
Siemens Scholarship
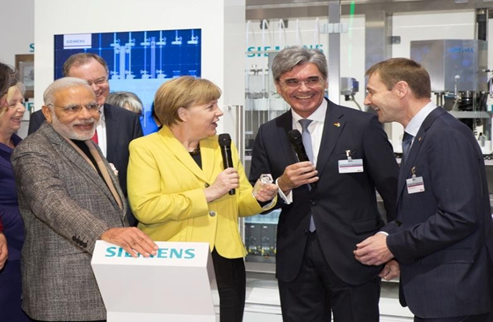
Siemens India reaffirmed its commitment to Partner India at the Hannover Fair, showcasing integrated technologies for manufacturing automation and Smart Cities from the comprehensive electrification, automation and digitalization portfolio.
In the first quarter this year, Siemens achievements are
-
First GIS contract with Fixed Series Compensators from PowerGrid
-
Contract for 220kV GIS substation from Bihar Grid worth Rs. 317 crore
-
Order worth Rs. 450 crore from Diesel Locomotive Works for propulsion / control equipment from our factories at Kalwa & Nashik
-
Signed MOU with CII for Siemens to spearhead the conceptualization and implementation of pilot Smart City projects
-
Won recognition for International Efficiency (IE) class industrial motors manufactured in India, displayed at
-
Hannover Messe 2015.
Continued Focus on Driving Profitable Growth
-
Focus on winning projects where the government thrust on spending is high e.g. in the Energy and Railway segments
-
Lead the discussion with Industry partners to drive digitalization and higher levels of automation in factories
-
Partner with city stakeholders to reap the full potential of urban infrastructure with Smart City solutions
-
Diligent execution of order book to ensure capital efficient and profitable growth.
VALUATION
We trust that once the financial recuperation is set in, we will begin to see critical request inflows prompting profit updates. The emphasis on expense streamlining and confinement ought to help aggressiveness which will help SIEM once the business sector recuperates.
|
KEY RATIOS |
201209 |
201309 |
201409 |
|
- Debt Equity Ratio |
0.14 |
0.18 |
0.3 |
|
- Current Ratio |
1.75 |
1.78 |
1.88 |
|
- Debtors Velocity |
94.1 |
85.14 |
82.77 |
|
- Creditors Velocity |
55.39 |
65.09 |
46.6 |
SIEM is currently trading at 1350 per share with a market capitalization of 48607 Crores. It has total debt of 319.5 Cr with long term Debt to Equity of 0.03. It has total cash and bank balance of 1121 Cr. It paid Rs.6.00 per share(300%) as Dividend last Fiscal.
We value SIEM using DCF at price target of 1433 for FY16 with expected growth rate at 10.94% per annum. For valuation we assume that over the period company will keep capital structure unaltered and tax rate unchanged.
|
|
B H E L |
Crom Greaves |
ALSTOM India |
Kirl. Electric |
W S Inds. |
|
Siemens |
|
|
in mil |
|
|
||||||
|
Sales |
31274.17 |
14013.14 |
2124.29 |
510.35 |
13.46 |
|
10662.6 |
|
|
PAT |
1450.44 |
206.36 |
176.88 |
-240.04 |
-46.39 |
603.2 |
||
|
Equity |
489.52 |
125.35 |
67.23 |
53.18 |
21.14 |
71.2 |
Industry |
|
|
|
|
Average |
||||||
|
OPM % |
10.44 |
5.26 |
13.71 |
-11.62 |
-112.19 |
|
6.06 |
9.80 |
|
NPM % |
4.64 |
1.47 |
8.33 |
-47.03 |
-344.65 |
5.66 |
4.81 |
|
|
EPS |
5.68 |
3.13 |
24.27 |
0 |
0 |
15.74 |
11.03 |
|
|
|
||||||||
|
PE |
39.65 |
50.42 |
27.39 |
-0.66 |
-0.48 |
|
48.82 |
39.15 |
|
P/BV |
1.68 |
2.75 |
4.97 |
-0.92 |
-0.12 |
6.73 |
3.13 |
|
|
P/EPS |
22.69 |
22.07 |
19.39 |
-0.69 |
-0.55 |
35.38 |
21.38 |
|
|
BV |
139.76 |
60.45 |
145.03 |
-32.12 |
-87.44 |
122.88 |
|
|
CONCUSSION AND RECOMMENDATION
The emphasis on expense streamlining and confinement ought to help aggressiveness which will help SIEM once the business sector recuperates. We value SIEM using DCF at price target of 1433 for FY16 with expected growth rate at 10.94% per annum. We recommend BUY on the stock at CMP of Rs. 1350 to the above target.
RISKS AND CONCERNS
-
Company has posted uneven trend in quarterly EBITDA margin. If this continues, it may hinder the valuation and its value.
-
Low oil prices present a two-sided risk.
On the downside, oil prices could rebound faster than expected if supply is curtailed more quickly in response to lower prices, withdrawing support for demand. On the upside, the demand impulse from the boost to real
incomes from the oil price windfall could be stronger than currently anticipated.
-
Protracted low inflation or deflation could weigh on growth.
FINANCIALS
Siemens Ltd. key Products/Revenue Segments include
-
Engineering Products which contributed Rs 4350.60 Cr to Sales Value (40.80% of Total Sales)
-
Others which contributed Rs 2453.40 Cr to Sales Value (23.00% of Total Sales)
-
Medical Diagnostic Equipment which contributed Rs 1128.80 Cr to Sales Value (10.58% of Total Sales)
-
Switch Gear Items which contributed Rs 1116.40 Cr to Sales Value (10.47% of Total Sales)
-
Sale of services which contributed Rs 726.00 Cr to Sales Value (6.80% of Total Sales)
-
Switchboards Controlboards & Misc. Access which contributed Rs 641.40 Cr to Sales Value (6.01% of Total Sales)
-
Other Operating Revenue which contributed Rs 177.20 Cr to Sales Value (1.66% of Total Sales)
-
Commission which contributed Rs 31.70 Cr to Sales Value (0.29% of Total Sales)
-
Rent which contributed Rs 23.60 Cr to Sales Value (0.22% of Total Sales)
-
Export Incentives which contributed Rs 13.50 Cr to Sales Value (0.12% of Total Sales)
For the quarter ended 30-Jun-2015, the company has reported a Standalone sales of Rs. 2322.01 Cr., down -10.31% from last quarter Sales of Rs. 2588.89 Cr. and up 0.14% from last year same quarter Sales of Rs. 2318.74 Cr. Company has reported net profit after tax of Rs. 168.26 Cr. in latest quarter.
Performance 2015 YTD
-
Continuing operations +5.9% in Q2 (+5.1% YTD)
-
Major order received DLW +4”5 in Q2
-
Continuing operations +4.7% in Q2 (-1.4% YTD)
-
Reduction mainly due to HC alignment of revenue recognition IGAAP / IND AS -1“8 in Q1
-
Continuing operations @ 7.6% in Q2 (7.4% YTD)
-
Better margin order execution
-
Favorable forex +270‟
Lengthened working capital cycle:
The steep reduction in advances from customers (down 19% YoY at Rs14bn), rise in debtor days (from 111 in FY12 to 121 in FY13) and inventory days (from 27 in FY12 to 30 in FY13) led ex-cash net working capital as a percentage of sales to rise from 1.8% in FY12 to 4.7% in FY13, while the cash balance fell 38% YoY at Rs6bn in FY13.
New Orders (YTD)
Order Growth continues (+5.1% YTD cont. operations)
-
Slowdown in Capex of Power Generation projects
-
Transmission and Distributionbegins to pick up with Government support
-
Railways releasing large orders and enquiries (Siemens won 4”5 order from DLW)
-
Industrial Capex still sluggish
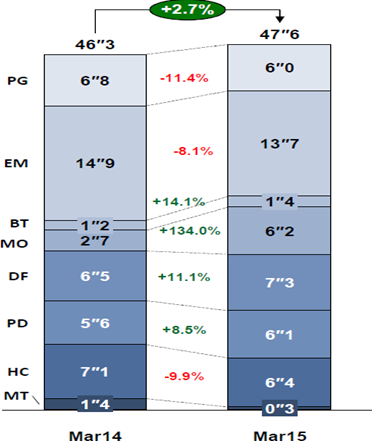
Net Sales (YTD) Revenue in line with expectations (-1.4% YTD cont. operations)
HC: Alignment of revenue recognition in IGAAP/IND AS -1"8; underlying growth 14%
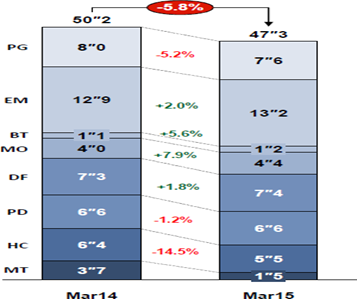
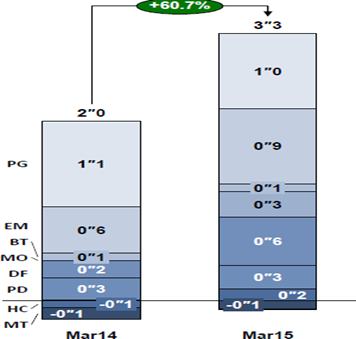
Profit from Operations (PFO) (YTD)
Profitability improved in almost all Divisions
-
Execution of better margin orders
-
Conscious cost management
-
Forex gain of +270‟
|
Yearly Income Statement |
2013 |
2014 |
2015 E |
2016 E |
2017 E |
2018 E |
|
Net Sales |
11145.24 |
10448.27 |
10823 |
12007.04 |
13320.61 |
14777.88 |
|
Other Income |
66.96 |
486.58 |
632.78 |
500 |
500 |
500 |
|
Other Operating Income |
207.42 |
214.3 |
210 |
211.27 |
211.43 |
211.59 |
|
Total Income |
11419.62 |
11149.15 |
11665.78 |
12718.31 |
14032.04 |
15489.47 |
|
Total Expenditure |
10931.96 |
10068.31 |
10486.40 |
11613.21 |
12791.78 |
14253.27 |
|
EBIDTA |
487.66 |
1080.84 |
1179.38 |
1105.10 |
1240.26 |
1236.20 |
|
Depreciation |
250.19 |
229.11 |
233.32 |
260.73 |
294.67 |
333.02 |
|
EBIT |
237.47 |
851.73 |
946.0597 |
844.3755103 |
945.5853015 |
903.1811385 |
|
Interest |
18.89 |
8.18 |
61.49 |
57.00 |
66.19 |
65.48 |
|
PBT |
218.58 |
843.56 |
884.57 |
787.38 |
879.39 |
837.70 |
|
Tax |
24.63 |
240.37 |
265.37 |
267.71 |
294.60 |
276.44 |
|
Deferred Tax |
0 |
0 |
0 |
0 |
0 |
0 |
|
Adjusted Profit After Tax |
193.95 |
603.19 |
619.20 |
519.67 |
584.80 |
561.26 |
|
Minority Interest After NP |
0 |
0 |
0 |
0 |
0 |
0 |
|
Profit/Loss of Associate Company |
0 |
0 |
0 |
0 |
0 |
0 |
|
Extra-ordinary Items |
28.8 |
273.66 |
200.00 |
175.00 |
200.00 |
191.67 |
|
Adjusted Profit After Extra-ordinary item |
165.15 |
329.53 |
419.20 |
344.67 |
384.80 |
369.59 |
|
|
||||||
|
Equity |
31.14 |
31.14 |
31.14 |
31.14 |
31.14 |
31.14 |
|
EPS (Unit Curr.) |
4.64 |
9.25 |
11.77 |
9.68 |
10.81 |
10.38 |
|
Outstanding Shares |
356120255 |
356120255 |
356120255 |
356120255 |
356120255 |
356120255 |
|
|
||||||
|
EBIDTA Margin |
4.38% |
10.34% |
10.90% |
9.20% |
9.31% |
8.37% |
|
EBIT Margin |
2.13% |
8.15% |
8.74% |
7.03% |
7.10% |
6.11% |
|
PAT Margin |
1.45% |
2.96% |
3.59% |
2.71% |
2.74% |
2.39% |
- Share :


Post a Comment
|
DISCLAIMER |
This report is only for the information of our customers. Recommendations, opinions, or suggestions are given with the understanding that readers acting on this information assume all risks involved. The information provided herein is not to be construed as an offer to buy or sell securities of any kind. ATS and/or its group companies do not as assume any responsibility or liability resulting from the use of such information.