Prestige Estates Projects
Prestige Estates Projects Limited - Background
Prestige Estates Projects Limited is engaged in the development and construction of properties, and leasing of commercial properties. The Company operates in five segments: Residential, Commercial, Retail, Hospitality and Property Management Services. It has developed a diversified portfolio of real estate development projects focusing on the projects in residential (apartments, plotted developments and integrated townships), commercial (corporate office blocks, built–to–suit facilities, technology parks and campuses), hospitality (hotels, resorts and serviced accommodation) and retail (shopping malls) segments. Its real estate services business focuses on property management services for its real estate projects, sub leasing and fit out services, project and construction management services, and mall management and facilities management (the operation of its hospitality business) services. Source: Reuters

|
Key Parameters |
|
|
BSE Code |
533274 |
|
NSE Code |
PRESTIGE |
|
Reuters Code |
PREG.NS |
|
CMP (as on 01/12/2015) |
204.10 |
|
Stock Beta |
1.56 |
|
52 Week H/L |
323.70/181.00 |
|
Market Cap (Cr) |
7743.75 |
|
Equity Capital (Rs cr) |
375 |
|
Face Value (Rs) |
10 |
|
Average Volume |
262390 |
|
|
|
|
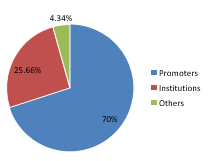
Shareholding Pattern (%) |
|
|
Promoters |
70 |
|
Non Institutions |
30 |
|
Grand Total |
100 |
Prestige Estates Projects Limited - Investment Rationale
-
Mortgage Penetration to improve
-
Commercial Real Estate demand to pickup
-
Increase in demand new launches to drive sales volume
-
Smart cities
-
Favorable demographics
Prestige Estates Projects Limited - Risks and Concerns
-
Limited presence
-
Unsold inventory
-
Cost fluctuations
Prestige Estates Projects Limited - Conclusion & Recommendation
PEPL being a dominant player in Indian real estate industry with brand name, wide range of offerings and news launches in different segments. We expect the company to outperform the industry when the demand picks up.
At the current market price of Rs.204.10 the stock is trading at 14x FY17E EPS. Investors could buy the stock at CMP and add on dips to around Rs.186 to Rs.190 levels (~13x FY17E EPS) for our sequential targets of Rs.248 and Rs.276 (~17x to ~19x FY17E EPS).
Financial Summary
|
Particulars (Rs. in Crs) |
FY13 |
FY14 |
FY15 |
FY16E |
FY17E |
|
Net Sales |
1930.52 |
2492.92 |
3320.41 |
3918.08 |
4701.70 |
|
Operating Profit |
642.67 |
817.83 |
1092.5 |
1270.82 |
1520.29 |
|
PAT |
285.97 |
314.28 |
332.37 |
413.28 |
542.77 |
|
EPS (Rs.) |
7.63 |
8.38 |
8.86 |
11.02 |
14.47 |
|
PE |
26.76 |
24.35 |
23.03 |
18.52 |
14.10 |
Prestige Estates Projects Limited - Company Profile
Business profile
|
Residential |
Apartments |
Villas |
Townships |
Plots |
|
Commercial |
Office Space |
Built to suitCampuses |
SEZs |
IT parks |
|
Retail |
Malls |
|
|
|
|
Hospitality |
Resorts |
Serviced Apartments |
Hotels |
Food Courts |
|
Services |
Sub leasing & fit out services |
Interior Design & Execution |
Facilities & Property Mgt |
Project & Construction Mgt Services |
Geographical breakup of ongoing projects
|
City |
No. of projects |
Developable Area (MnSF) |
Percentage |
|
Bangaluru |
52 |
54.26 |
83% |
|
Chennai |
3 |
5.74 |
9% |
|
Cochin |
4 |
1.75 |
3% |
|
Hyderabad |
3 |
3.04 |
4% |
|
Mysuru |
2 |
0.66 |
1% |
|
Total |
64 |
65.45 |
100% |
Segment wise breakup of ongoing projects
|
Segment |
No. of projects |
Developable Area (MnSF) |
Percentage |
|
Residential |
50 |
56.6 |
86% |
|
Commercial |
5 |
4.32 |
7% |
|
Retail |
6 |
2.78 |
4% |
|
Hospitality |
3 |
1.75 |
3% |
|
Total |
64 |
65.45 |
100% |
Geographical breakup of upcoming projects
|
City |
No. of projects |
Developable Area (MnSF) |
Percentage |
|
Bangalore |
23 |
31.13 |
77% |
|
Chennai |
2 |
1.4 |
4% |
|
Cochin |
2 |
2.07 |
5% |
|
Mangalore |
2 |
1.39 |
3% |
|
Hyderabad |
2 |
4.65 |
11% |
|
Ooty |
2 |
0.07 |
|
|
Total |
33 |
40.71 |
100% |
Segment wise breakup of upcoming projects
|
Segment |
No. of projects |
Developable Area (MnSF) |
Percentage |
|
Residential |
24 |
28.96 |
71% |
|
Commercial |
7 |
9.97 |
25% |
|
Retail |
2 |
1.7 |
4% |
|
Total |
33 |
40.71 |
100% |
Shareholding Pattern (FY16)
Investment Rationale
Mortgage Penetration to improve
Over the past five years loan disbursals by housing finance companies have grown by 30-40 per cent annually. Despite such growth, mortgage loans are presently only 4-5 per cent of GDP, primarily due to the low penetration of mortgage financing. Banks and housing finance companies have planned to increase penetration aggressively. The housing finance market in India will expand to include borrowers who are currently not being serviced by financial institutions (typically these borrowers are in low-to-mid income segment and may not have formal income proof). There are a large number of NBFCs operating in the HFC segment, and recent regulatory changes will see many more HFCs come up in India to cater to specific customer segments. Most of the growth is expected to take place in the midmarket and premium/luxury sub-segments. Prestige being a leading player in this segment, we expect it to become a major beneficiary in this segment, with its offerings.
Commercial Real Estate demand to pickup
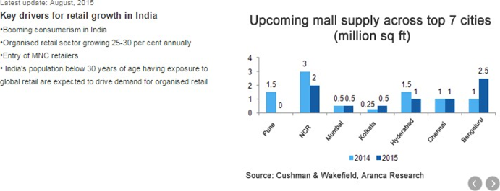
In the last until 2014, the supply of office real estate was higher than demand by 4 to 10 mn sqft. Though office real estate prices failed to recover from the after-effects of the financial crisis up to late 2014, the beginning of a gradual turnaround was observed. This can be attributed to the fact that commercial real estate developers began to strategically reduce the incoming supply to a new-normal level of occupier demand in the range of 27 to 30 mn sq. ft. each year. This helped bring down the vacancy rate to 17% from more than 18.5% just a year ago. In 2015, demand is projected to remain in this range, marginally improving from the level seen in 2014. The trend of moderate-to- healthy leasing activity will continue in 2015. India is going to produce an estimated 2 mn new graduates from various Indian universities during the current year, creating demand for 100 mn square feet of office and industrial space. As ~25% upcoming projects of prestige caters commercial real estate, which will offer good opportunities for the company.
Increase in demand new launches to drive sales volume
One of the major problems faced by players in the domestic real estate market is huge finished inventory. With the improvement in economic scenario, reduction in interest rates, aggressive pricing by the companies, and the volume of sales is expected to pick up in the second half of FY16,. It also has ongoing 64 and upcoming 33 projects spread across residential, commercial, retail and hospitality. PEPL is expected to be major beneficiary when the demand picks up.
Smart cities
Government plans to spend over Rs 3 lakh crore over the next 5-6 years to recast urban cities. Of the 98 smart cities, 24 are business and industry centers, 18 are cultural and tourist centers and 3 are education and health care hubs The development of Indian smart cities, with modern, highly efficient infrastructure for electricity, transport and IT, will create a new competitive landscape for the sub-continent that will be much more attractive for foreign direct investment by global multinationals. The government, which has called for 'Housing for all' by 2022. The government has identified 305 cities and towns across nine states for implementation of its ambitious 'Housing for All' scheme. PEPL with its reach and capabilities will be in a position to capitalize on the same.
Favorable demographics
About 10million people are moving into cities annually. India have aspirational young population, rising urbanisation, growing middle-class population with high disposable income, along with the government’s liberal economic policies are the strong growth drivers for the sector. Urban areas are expected to contribute 70-75 per cent to nations GDP by 2025. India’s Real Estate market size is expected to increase seven times by 2028 from USD 121 bn in 2013 to USD 853 bn. The housing sector alone contributes 5-6% to the country’s gross domestic product (GDP). Also, in the period between 2008 and 2020, the market size of this sector is expected to increase at a compound annual growth rate (CAGR) of 11.2%. Retail, hospitality and commercial real estate are also growing significantly, providing the much-needed infrastructure for India’s growing needs. In addition, real estate is now increasingly looked upon as an investment rather than necessity. These trends augur well for the sector as a whole and PEPL in particular, which has a strong presence in some of the major cities of India.
Strong partnerships
PEPL have strong alliances and partnerships with companies who are leaders their respective areas. These include CRIDF (associate of Capita Malls Asia - one of Asia’s largest pure-play shopping mall owners, developers and managers) for our retail projects and Marriott, Hilton, Starwood, and Banyan Tree Hotel & Resorts for hospitality projects. We have joint ventures with RedFort and CapitaLand for real estate projects. It also develop projects on contractual partnerships with land owners i.e. joint development model. Its clients include Commercial CISCO, Adobe, Exxon Mobile, Apple, Oracle, Accenture, JP Morgan, 3M, HUL, Capegemini, Bosch, Citrix, PVR and retail clients include Zara, Forever 21, Lifestyle, Spar, Westside, Shoppers Stop, Central, Louis Vuitton, Diesel, Canali and Tumi. These partnerships enable the company to company to generate revenue along with the growth of its clients.
Consistent growth
The turnover of the company is growing at a CAGR of 16.91%, EBITDA at 19.85%, PAT at 16.37% and book value at 9.59% in the last five years. PEPL have land bank of 347 acres, and it also completes the projects on time which adds to the competitive advantage to the company.
Well diversified offerings
Company with interests and operations across the gamut of sectors and asset classes. It has diversified across residential, commercial, retail and hospitality constructions and real estate services, proofing our revenue stream against sectoral downturns. PEPL is among the few companies the industry to indulge in site development, project designing, construction, interior designing and post-completion project management; all under one roof. It also have very competitive pricing model for its offerings in different market segments. This will help the company to capitalize on the available opportunities in various segments of the market.
Real estate as investment
For the Non-Resident Indians (NRIs) and People of Indian Origin (PIO) the Indian real estate have never had it so good. The rupee depreciation had made the investments in real estate a good bet for most investors. PEPL a well-established brand attracts more and more investors from India and abroad who are putting money in real estate as a source of investment.
Industry Profile
Introduction
The real estate sector is one of the most globally recognized sectors. In India, real estate is the second largest employer after agriculture and is slated to grow at 30 per cent over the next decade. The real estate sector comprises four sub sectors - housing, retail, hospitality, and commercial. The growth of this sector is well complemented by the growth of the corporate environment and the demand for office space as well as urban and semi-urban accommodations. The construction industry ranks third among the 14 major sectors in terms of direct, indirect and induced effects in all sectors of the economy. It is also expected that this sector will incur more non-resident Indian (NRI) investments in both the short term and the long term. Bengaluru is expected to be the most favoured property investment destination for NRIs, followed by Ahmedabad, Pune, Chennai, Goa, Delhi and Dehradun.
Market Size
The Indian real estate market is expected to touch US$ 180 billion by 2020. The housing sector alone contributes 5-6 percent to the country's Gross Domestic Product (GDP). In the period FY08-20, the market size of this sector is expected to increase at a Compound Annual Growth Rate (CAGR) of 11.2 percent. Retail, hospitality, and commercial real estate are also growing significantly, providing the much-needed infrastructure for India's growing needs. Real estate has emerged as the second most active sector, raising US$ 1.2 billion from private equity (PE) investors in the last 10 months. Foreign investors have bought tenanted office space worth over US$ 2 billion in India in 2014, a four-fold rise compared to the previous year, in order to increase their rent-yielding commercial assets in Asia's third-largest economy.
Mumbai is the best city in India for commercial real estate investment, with returns of 12-19 percent likely in the next five years, followed by Bengaluru and Delhi-National Capital Region (NCR). Also, Delhi-NCR was the biggest office market in India with 110 million sq ft, out of which 88 million sq ft were occupied. Sectors such as IT and ITeS, retail, consulting and e-commerce have registered high demand for office space in recent times. Delhi’s Central Business District (CBD) of Connaught Place has been ranked as the sixth most expensive prime office market in the world with occupancy costs at US$ 160 per sq ft per annum.
While commercial real estate is expecting to see much action, residential housing may lag. Any benefit coming from introduction of REITs is likely to remain confined to commercial real estate. While developers in the residential segment may not see REIT funds coming their way, other factors may play out in their favour. “The housing market is likely to see a shift from luxury towards affordable housing projects, with affordable price points hopefully leading to higher absorption levels. Developer emphasis on clearing inventory levels and meeting construction deadlines is seen as an encouraging step for the segment,” said the report.
Lower interest rates on home loans is one such factor that homebuyers as well as developers are waiting for. While the Reserve Bank of India reduced repo rates by 25 basis points in January and March each, expectation is high that it may go for a further rate cut. If that happens, and lending institution pass on the benefit to home loans, potential homebuyers who have been sitting on the fence are likely to take a buy decision.
-
The Government of India along with the governments of the respective states have taken several initiatives to encourage the development in the sector. The Smart City Project, where there is a plan to build 100 smart cities, is a prime opportunity for the real estate companies. Below are some of the other major Government Initiatives:
-
India’s Prime Minister Mr Narendra Modi approved the launch of Housing for All by 2022. Under the Sardar Patel Urban Housing Mission, 30 million houses will be built in India by 2022, mostly for the economically weaker sections and low-income groups, through public-private-partnership (PPP) and interest subsidy.
-
The Government of India has relaxed the norms to allow Foreign Direct Investment (FDI) in the construction development sector. This move should boost affordable housing projects and smart cities across the country.
-
The Securities and Exchange Board of India (SEBI) has notified final regulations that will govern real estate investment trusts (REITs) and infrastructure investment trusts (InvITs). This move will enable easier access to funds for cash-strapped developers and create a new investment avenue for institutions and high net worth individuals, and eventually ordinary investors.
-
The Government of Maharashtra announced a series of measures to bring transparency and increase the ease of doing business in the real estate sector.
-
The State Government of Kerala has decided to make the process of securing permits from local bodies for construction of houses smoother, as it plans to make the process online with the launch of software called 'Sanketham'. This will ensure a more standardised procedure, more transparency, and less corruption and bribery.
Road Ahead
Responding to an increasingly well-informed consumer base and, bearing in mind the aspect of globalisation, Indian real estate developers have shifted gears and accepted fresh challenges. The most marked change has been the shift from family owned businesses to that of professionally managed ones. Real estate developers, in meeting the growing need for managing multiple projects across cities, are also investing in centralised processes to source material and organise manpower and hiring qualified professionals in areas like project management, architecture and engineering. The growing flow of FDI into Indian real estate is encouraging increased transparency. Developers, in order to attract funding, have revamped their accounting and management systems to meet due diligence standards.
Risks and Concerns
Limited presence
The offerings of PEPL are concentrated into limited geographies and it can affect the growth prospects of the company in a significant manner as it won’t be able to capitalize on demands in different markets.
Unsold inventory
PEPL have huge inventory of completed projects spared across different business verticals. Adverse demand situation can affect the inventory and it can hamper the company’s margins.
Cost fluctuations
The margins of the company is mainly depends on the cost expenses of the company. Increase in material cost and labour cost can adversely affect the margins of the company.
Financials
Quarterly analysis
-
Profits are 12.39 per cent higher for second quarter (Q2) of 2015-16 on standalone basis. The company Q2 profits are at Rs 108.90 crore against Rs 96.89 crore during the same period last year.
-
Total income of the company is also higher by 17.72 per cent at Rs 644.47 crore as against Rs 547.46 crore recorded last year. EPS basic stood at 2.90 (last year 2.66).
-
During the quarter, the company sold 693 residential units and 0.05 million square feet of commercial space, aggregating to 1.16 million square feet, which translates to sales of RS 709.1 crore. Of this, PEPL share is 619 units and 0.05 million square feet of commercial space, aggregating to 1.02 million square feet, which translates to sales of ₹605 crore.
-
As for the total collections for the quarter it aggregated to Rs 941.3 crore. (PEPL share of collections for the quarter aggregated to Rs 775.5 crore). Similarly last year, total collections stood at Rs 961.2 crore and PEPL share of collections was Rs810.1 crore.
Q2FY16
|
|
2nd Qtr 201509 |
2nd Qtr 201409 |
VAR [%] |
2nd Qtr 201509 |
1st Qtr 201506 |
VAR [%] |
|
Gross Sales |
550.12 |
505.88 |
8.7 |
550.12 |
695.17 |
-20.9 |
|
Excise Duty |
0 |
0 |
0 |
0 |
0 |
0 |
|
Net Sales |
550.12 |
505.88 |
8.7 |
550.12 |
695.17 |
-20.9 |
|
Other Operating Income |
94.35 |
34.45 |
173.9 |
94.35 |
96.3 |
-2.0 |
|
Other Income |
34.37 |
43.99 |
-21.9 |
34.37 |
26.73 |
28.6 |
|
Total Income |
678.84 |
584.32 |
16.2 |
678.84 |
818.2 |
-17.0 |
|
Total Expenditure |
494.56 |
388.15 |
27.4 |
494.56 |
606.41 |
-18.4 |
|
PBIDT |
184.28 |
196.17 |
-6.1 |
184.28 |
211.79 |
-13.0 |
|
Interest |
54.81 |
46.83 |
17 |
54.81 |
53.85 |
1.8 |
|
PBDT |
129.47 |
149.34 |
-13.3 |
129.47 |
157.94 |
-18.0 |
|
Depreciation |
12.67 |
9.47 |
33.8 |
12.67 |
12 |
5.6 |
|
PBT |
116.8 |
139.87 |
-16.5 |
116.8 |
145.94 |
-20.0 |
|
Tax |
7.9 |
42.98 |
-81.6 |
7.9 |
17.77 |
-55.5 |
|
Reported Profit After Tax |
108.9 |
96.89 |
12.4 |
108.9 |
128.17 |
-15.0 |
|
Adj Profit After Extra-ordinary item |
108.9 |
96.89 |
12.4 |
108.9 |
128.17 |
-15.0 |
|
PBIDTM(%) |
33.5 |
38.78 |
-13.6 |
33.5 |
30.47 |
9.9 |
|
PBDTM(%) |
23.53 |
29.52 |
-20.3 |
23.53 |
22.72 |
3.6 |
|
PATM(%) |
19.8 |
19.15 |
3.4 |
19.8 |
18.44 |
7.4 |
Profit and Loss Account as per rough estimates
|
|
FY13 |
FY14 |
FY15 |
FY16E |
FY17E |
|
Gross Sales |
1930.52 |
2492.92 |
3320.41 |
3918.08 |
4701.70 |
|
Excise Duty |
0 |
0 |
0 |
0 |
0 |
|
Net Sales |
1930.52 |
2492.92 |
3320.41 |
3918.08 |
4701.70 |
|
Other Operating Income |
17.08 |
56.27 |
99.35 |
103.28 |
123.63 |
|
Other Income |
63.56 |
97.5 |
98.64 |
109.66 |
127.20 |
|
Total Income |
2011.16 |
2646.69 |
3518.4 |
4131.02 |
4952.53 |
|
Total Expenditure |
1368.49 |
1828.86 |
2425.9 |
2860.20 |
3432.24 |
|
PBIDT |
642.67 |
817.83 |
1092.5 |
1270.82 |
1520.29 |
|
Interest |
148.91 |
229.04 |
321.36 |
350.10 |
358.83 |
|
PBDT |
493.76 |
588.79 |
771.14 |
920.73 |
1161.46 |
|
Depreciation |
68.18 |
89.26 |
139.7 |
164.06 |
189.92 |
|
PBT |
425.58 |
499.53 |
631.44 |
756.67 |
971.54 |
|
Tax |
131.44 |
175.04 |
264.69 |
310.23 |
398.33 |
|
Reported Profit After Tax |
294.14 |
324.49 |
366.75 |
446.43 |
573.21 |
|
Minority Interest After NP |
4.84 |
7.2 |
35.12 |
32.41 |
29.70 |
|
Profit/Loss of Associate Company |
-3.33 |
-3.01 |
0.74 |
0.74 |
0.74 |
|
Net Profit after Minority Interest & P/L Asso.Co. |
285.97 |
314.28 |
332.37 |
413.28 |
542.77 |
Balance Sheet as per rough estimates
|
|
FY13 |
FY14 |
FY15 |
FY16E |
FY17E |
|
SOURCES OF FUNDS: |
|
|
|
|
|
|
Share Capital |
350 |
350 |
375 |
375 |
375 |
|
Reserves & Surplus |
2392.27 |
2629.19 |
3445.6 |
3745.60 |
4105.60 |
|
Minority Interest |
261.96 |
299.02 |
397.48 |
403.61 |
409.73 |
|
Loan Funds |
2420.02 |
2805.49 |
3852.79 |
4152.79 |
4352.79 |
|
Deferred Tax Liability |
11.93 |
7.03 |
2.11 |
3.07 |
4.03 |
|
Other Liabilities |
105.71 |
145.53 |
205.24 |
173.47 |
181.29 |
|
Total Liabilities |
5541.89 |
6236.26 |
8278.22 |
8853.54 |
9428.45 |
|
APPLICATION OF FUNDS: |
|
|
|
|
|
|
Fixed Assets |
2492.95 |
2920.5 |
3281.6 |
3719.60 |
4181.04 |
|
Intangible Assets |
448.99 |
451.99 |
504.02 |
523.36 |
550.88 |
|
Investments |
174.97 |
288.7 |
278.71 |
277.77 |
270.79 |
|
Current Assets, Loans & Advances |
3693.54 |
4473.93 |
7061.36 |
7749.37 |
8687.35 |
|
Inventories |
1740.83 |
2536.18 |
4259.85 |
4744.86 |
5276.99 |
|
Sundry Debtors |
801.01 |
725.75 |
884.02 |
886.60 |
928.11 |
|
Cash & Bank Balance |
488 |
339.54 |
536.79 |
544.21 |
568.61 |
|
Other Current Assets |
25.6 |
82.31 |
101.91 |
121.51 |
141.11 |
|
Loans & Advances |
638.1 |
790.15 |
1278.79 |
1452.20 |
1772.54 |
|
Current Liabilities & Provisions |
2218.51 |
3106.18 |
4077.53 |
4669.45 |
5537.26 |
|
Current Liabilities |
2069.01 |
2932.69 |
3851.83 |
4430.80 |
5285.66 |
|
Provisions |
149.5 |
173.49 |
225.7 |
238.65 |
251.60 |
|
Net Current Assets |
1475.03 |
1367.75 |
2983.83 |
3079.93 |
3150.09 |
|
Deferred Tax Assets |
0.92 |
0.78 |
0.89 |
1.10 |
1.22 |
|
Other Assets |
949.03 |
1206.54 |
1229.17 |
1251.80 |
1274.43 |
|
Total Assets |
5541.89 |
6236.26 |
8278.22 |
8853.55 |
9428.45 |
Conclusion and Recommendation
We are positive on PEPL over the long term and hence recommend a BUY at CMP of RS.204.10 and further add on declines between Rs.190 to Rs.186 for a target of Rs.248 to Rs.276 with stop loss maintained at Rs.180.
- Share :


Post a Comment
|
DISCLAIMER |
This report is only for the information of our customers. Recommendations, opinions, or suggestions are given with the understanding that readers acting on this information assume all risks involved. The information provided herein is not to be construed as an offer to buy or sell securities of any kind. ATS and/or its group companies do not as assume any responsibility or liability resulting from the use of such information.