Pidilite Industries Limited Research Report
|
Industry |
Market Price |
Recommendation |
Target |
Time Horizon |
|
Chemical |
2,332 |
Buy |
3,266 |
2 years |
Q4 FY 2022 Review
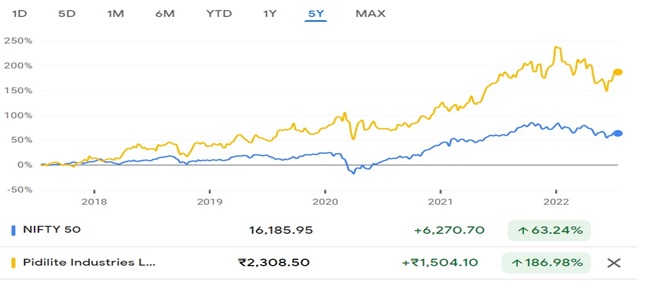
Pidilite Industries Limited reported net revenue of ₹2,507.10 crores for the quarter ended March 31, 2022, compared to ₹2,235.52 crores for March 31, 2021. EBIT and Profit After Tax were ₹350 crores and ₹254.35 crores for the quarter ended March 31, 2022, as compared to ₹429.93 crores and ₹307.44 crores, during the corresponding quarter of the previous year.
Pidilite Industries Limited - Investment Summary
|
CMP (₹) |
2,332 |
|
52 Week H/L |
1,989/2,765 |
|
Market Cap (crores) |
1,18,601 |
|
Face Value (₹) |
1.00 |
|
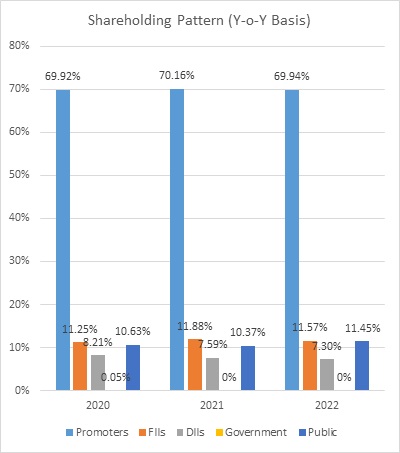
Promoter Holding (%) |
69.94 |
|
Non-Promoter Holding (%) |
30.06 |
|
Total (%) |
100.00 |
|
Book Value |
₹129 |
|
EPS TTM |
₹23.75 |
Pidilite Industries Limited - Overview
-
Pidilite Industries is India’s leading manufacturer of adhesives, construction chemicals, specialty chemicals, consumer, and maintenance products.
-
The company has a portfolio of over 1,000 products developed through strong-in-house R&D.
-
It has 6,000 distributors and 6,00,000 dealers/retailers across India.
-
It has manufacturing facilities in India, Bangladesh, Thailand, Singapore, Dubai, Brazil, U.S., and Egypt.
-
It has State-of-art R&D centers in India and Singapore.
Beta: 0.61 |
Alpha: 16.35 |
Risk Reward Ratio: 1.64 |
Margin of Safety: 29% |
Pidilite Industries Limited - Quarterly Summary
|
Quarterly (INR in crores) |
Mar-22 |
Dec-21 |
Sep-21 |
Jun-21 |
Mar-21 |
|
Revenue from Operations |
2,507 |
2,851 |
2,626 |
1,937 |
2,236 |
|
Other income |
11.11 |
5.17 |
13.9 |
6.12 |
17.33 |
|
Total Income |
2,518 |
2,856 |
2,640 |
1,943 |
2,253 |
|
|
|
|
|
|
|
|
Total Expenditure |
2168.21 |
2362.15 |
2137.09 |
1645.83 |
1831.92 |
|
EBIT |
350.00 |
493.74 |
503.16 |
297.08 |
420.93 |
|
|
|
|
|
|
|
|
Finance cost |
9.35 |
10.75 |
12.36 |
9.62 |
7.44 |
|
EBT before Exceptional Items and share of Profit of Associate |
340.65 |
482.99 |
490.80 |
287.46 |
413.49 |
|
|
|
|
|
|
|
|
Share of Profit of Associate |
5.22 |
3.73 |
0.65 |
2.28 |
1.32 |
|
EBT before Exceptional Items |
345.87 |
486.72 |
491.45 |
289.74 |
414.81 |
|
|
|
|
|
|
|
|
Exceptional Items |
0 |
0 |
0 |
0 |
3.62 |
|
PBT |
345.87 |
486.72 |
491.45 |
289.74 |
411.19 |
|
|
|
|
|
|
|
|
Tax Expenses |
91.52 |
127.48 |
115.92 |
72.1 |
103.75 |
|
PAT |
254.35 |
359.24 |
375.53 |
217.64 |
307.44 |
Business
-
Pidilite Industries Limited was incorporated on 28th July 1969.
-
Pidilite was the first company in India that started the production of violet pigment in the year 1973.
-
The company got listed on BSE in the year 1993.
-
Fevicol, the company’s premier brand, ranked among the top 15 Indian brands by the FE Bandwagon in 1997.
-
The company ranked among the best 100 brands in the year 2014.
-
Some of the company’s major brands include Fevicol, Fevicol MR, Dr. Fixit, Fevikwik, M-Seal, Fevistik, Hobby Idea’s, and Fevicryl.
-
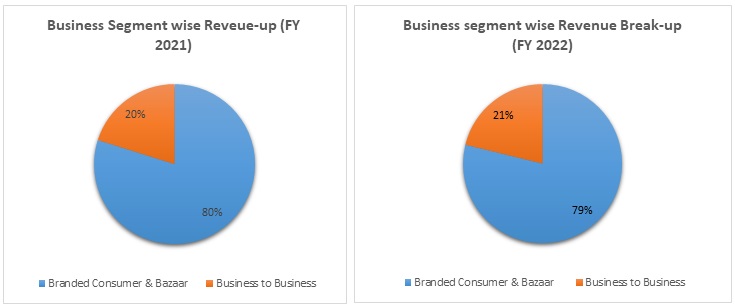
The company operates under two business segments:
-
Branded Consumer & Bazaar:
-
Products such as adhesives, sealants, art & craft materials, and construction and paint chemicals are covered under Branded Consumer & Bazaar.
-
These products are widely used by carpenters, painters, plumbers, mechanics, households, students, offices, and many more.
-
-
Business to Business:
-
Business to Business segment covers products such as industrial adhesives, industrial resins, construction chemicals, organic pigments, pigments preparation, and many more.
-
It caters to various industries like packages, joineries, textiles, paints, printing inks, paper, leather, etc.
-
-
-
Out of the total revenue, 79% of revenue have generated from Branded Consumer & Bazaar and 21% from Business to Business in FY 2022, compared to 80% and 20% in FY 2020.
-
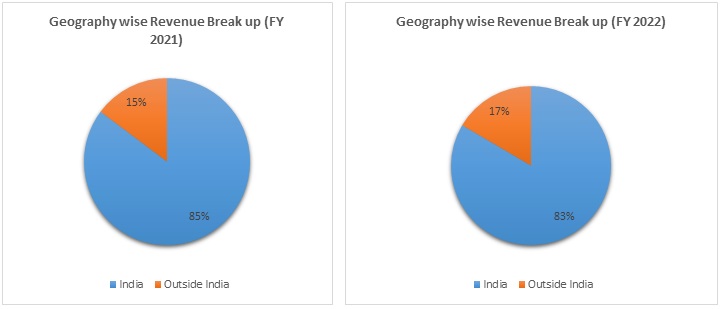
Out of total revenue, 85% of revenue is received from India and 15% from outside India in FY 2022, compared to 83% and 17% in FY 2021.
Pidilite Industries Limited - Ratio Analysis
|
|
Mar-19 |
Mar-20 |
Mar-21 |
Mar-22 |
|
Profitability Ratio |
|
|
|
|
|
Gross Profit |
51% |
55% |
55% |
45% |
|
EBITDA Margin |
21% |
24% |
24% |
19% |
|
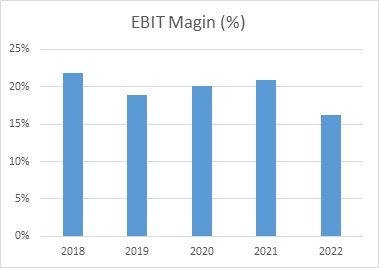
EBIT Margin |
20% |
21% |
21% |
17% |
|
Pre-Tax Margin |
37% |
36% |
38% |
36% |
|
Net Profit Margin |
13% |
15% |
15% |
12% |
|
|
||||
|
Return on Investment |
||||
|
Return on Asset – ROA |
17% |
18% |
15% |
13% |
|
Return on Capital Employed – ROCE |
32% |
33% |
28% |
24% |
|
Return on Equity – ROE |
24% |
26% |
22% |
20% |
|
|
||||
|
Liquidity Ratio |
||||
|
Current ratio (x) |
2.75 |
2.33 |
1.44 |
1.73 |
|
Quick Ratio |
2.04 |
1.75 |
0.94 |
1.00 |
|
|
||||
|
Turnover Ratio |
||||
|
Receivables Turnover |
7.1 |
6.8 |
6.1 |
7.2 |
|
Inventory Turnover |
4.1 |
3.7 |
3.1 |
3.7 |
|
Payables Turnover |
1.6 |
1.6 |
1.3 |
1.2 |
|
Asset Turnover |
1.3 |
1.2 |
0.9 |
1.1 |
|
|
||||
|
Solvency Ratio |
||||
|
Debt to Equity |
0 |
0 |
0 |
0 |
|
Interest Coverage Ratio |
53 |
46 |
42 |
39 |
Pidilite Industries Limited - Financial Overview
Profit and Loss Statement (₹ in crores)
|
|
Mar-19 |
Mar-20 |
Mar-21 |
Mar-22 |
|
Revenue from Operations |
7077.96 |
7294.47 |
7292.71 |
9920.96 |
|
Other Income |
146.64 |
149.43 |
79.4 |
36.3 |
|
Total Income |
7224.6 |
7443.9 |
7372.11 |
9957.26 |
|
|
||||
|
Cost of Goods sold |
3586.58 |
3402.5 |
3376.67 |
5444.18 |
|
Gross Profit |
3638.02 |
4041.4 |
3995.44 |
4513.08 |
|
|
||||
|
Excise Duty |
0 |
0 |
0 |
0 |
|
Employee Benefits Expense |
836.66 |
927.22 |
980.86 |
1112.36 |
|
Other Expenses |
1286.51 |
1388.73 |
1254.56 |
1517.13 |
|
EBITDA |
1514.85 |
1725.45 |
1760.02 |
1883.59 |
|
|
||||
|
Depreciation, Amortisation, and Impairment Expense |
132.74 |
169.92 |
200.66 |
239.61 |
|
EBIT |
1382.11 |
1555.53 |
1559.36 |
1643.98 |
|
|
||||
|
Finance Costs |
26.07 |
33.6 |
37.23 |
42.08 |
|
EBT before Exceptional Items, Share of Profit of Associates, and Joint Ventures |
1356.04 |
1521.93 |
1522.13 |
1601.9 |
|
|
||||
|
Share of Profit of Associates and Joint Ventures |
3.6 |
3.03 |
3.98 |
11.88 |
|
EBT before Exceptional Items |
1359.64 |
1524.96 |
1526.11 |
1613.78 |
|
|
||||
|
Exceptional Items |
18.02 |
55.19 |
3.62 |
0 |
|
EBT |
1341.62 |
1469.77 |
1522.49 |
1613.78 |
|
|
||||
|
Tax Expense |
413.23 |
347.72 |
396.36 |
407.02 |
|
PAT |
928.39 |
1122.05 |
1126.13 |
1206.76 |
|
|
||||
|
EPS |
||||
|
Basic |
18.28 |
22.09 |
22.16 |
23.75 |
|
Diluted |
18.27 |
22.08 |
22.15 |
23.73 |
|
|
||||
|
Number of Shares |
||||
|
Basic |
50.79 |
50.80 |
50.81 |
50.82 |
|
Diluted |
50.82 |
50.82 |
50.85 |
50.85 |
Pidilite Industries Limited - Cash Flow Statement (₹ in crores)
|
|
Mar-19 |
Mar-20 |
Mar-21 |
Mar-22 |
|
Net Profit Before Tax |
1,616.08 |
1,736.29 |
1,927.74 |
2,155.53 |
|
Net Cash from Operating Activities |
1,279.55 |
1,392.13 |
955.37 |
2,017.59 |
|
Net Cash Used for Investing Activities |
102.94 |
-1,687.89 |
-558.14 |
-390.24 |
|
Net Cash From (Used For) Financing Activities |
-849.21 |
-76.24 |
-467.96 |
-509.24 |
|
Net Increase in Cash and Cash Equivalents |
-28.92 |
533.28 |
-372.00 |
-70.73 |
|
Cash And Cash Equivalents at The Beginning of The Year |
102.19 |
73.27 |
606.55 |
327.15 |
|
Cash And Cash Equivalents at The End of the Year |
73.27 |
606.55 |
234.55 |
256.42 |
Pidilite Industries Limited - Balance Sheet (₹ in crores)
|
|
Mar-19 |
Mar-20 |
Mar-21 |
Mar-22 |
|
ASSETS: |
|
|
|
|
|
Non-Current Assets: |
|
|
|
|
|
Property, Plant, and Equipment |
913.32 |
1,141.95 |
1,285.03 |
1,554.86 |
|
Right of Use Assets |
- |
147.00 |
157.81 |
202.93 |
|
Capital Work-in-Progress |
242.13 |
259.33 |
293.87 |
225.42 |
|
Goodwill |
184.99 |
184.03 |
1,283.95 |
1,286.83 |
|
Other Intangible Assets |
349.30 |
333.73 |
1,691.13 |
1,658.64 |
|
Investments Accounted for Using Equity Method |
24.43 |
25.30 |
32.47 |
60.66 |
|
Finance Assets: |
||||
|
Investments |
371.87 |
441.16 |
307.04 |
224.43 |
|
Loans |
3.06 |
4.09 |
4.85 |
5.05 |
|
Other Financial Assets |
41.74 |
42.85 |
51.06 |
64.45 |
|
Income Tax Assets |
102.06 |
109.53 |
97.12 |
140.08 |
|
Deferred Tax Assets |
10.72 |
13.00 |
16.59 |
21.28 |
|
Other Non-Current Assets |
88.89 |
72.78 |
94.13 |
55.38 |
|
Total Non-Current Assets |
2,332.51 |
2,774.75 |
5,315.05 |
5,500.01 |
|
|
||||
|
Current Assets: |
||||
|
Inventories |
934.45 |
929.47 |
1,234.15 |
1,695.09 |
|
Financial Assets: |
||||
|
Investments |
1,151.40 |
719.73 |
176.46 |
173.52 |
|
Trade Receivables |
1,056.01 |
1,088.50 |
1,321.02 |
1,430.54 |
|
Cash and Cash Equivalents |
128.12 |
692.23 |
442.65 |
352.07 |
|
Other Bank Balances |
62.31 |
11.02 |
8.81 |
3.10 |
|
Loans |
12.12 |
17.38 |
16.89 |
17.22 |
|
Other Financial Assets |
71.61 |
103.18 |
85.26 |
86.01 |
|
Current Tax Assets |
2.62 |
1.93 |
3.13 |
2.95 |
|
Other Current Assets |
163.36 |
197.51 |
227.00 |
255.11 |
|
Asset Held for Sale |
- |
- |
- |
- |
|
Total Current Assets |
3,582.00 |
3,760.95 |
3,515.37 |
4,015.61 |
|
|
||||
|
Total Assets |
5,914.51 |
6,535.70 |
8,830.42 |
9,515.62 |
|
|
||||
|
EQUITY AND LIABILITIES: |
||||
|
Equity: |
||||
|
Equity Share Capital |
50.80 |
50.81 |
50.82 |
50.83 |
|
Other Equity |
4,097.29 |
4,404.80 |
5,542.14 |
6,352.88 |
|
Equity Attributable to Owners of the Company |
4,148.09 |
4,455.61 |
5,592.96 |
6,403.71 |
|
|
||||
|
Non-Controlling Interests |
207.15 |
215.65 |
240.04 |
198.90 |
|
Total Equity |
4,355.24 |
4,671.26 |
5,833.00 |
6,602.61 |
|
|
||||
|
Liabilities: |
||||
|
Non-Current Liabilities: |
||||
|
Financial Liabilities: |
||||
|
Borrowings |
8.51 |
25.13 |
12.39 |
1.72 |
|
Lease Liabilities |
- |
83.08 |
80.68 |
96.04 |
|
Other Financial Liabilities |
85.98 |
7.26 |
13.63 |
19.94 |
|
Provisions |
43.93 |
51.95 |
57.98 |
71.83 |
|
Deferred Tax Liabilities |
120.14 |
82.29 |
398.03 |
398.45 |
|
Total Non-Current Liabilities |
258.56 |
249.71 |
562.71 |
587.98 |
|
|
||||
|
Current Liabilities: |
||||
|
Borrowings |
102.54 |
143.99 |
201.51 |
285.62 |
|
Trade Payables: |
||||
|
Total Outstanding Dues of Micro and Small Enterprises |
31.55 |
23.13 |
86.03 |
89.50 |
|
Other Creditors |
549.09 |
597.88 |
920.71 |
959.79 |
|
Lease Liabilities |
- |
28.39 |
27.71 |
32.45 |
|
Other Financial Liabilities |
497.22 |
668.74 |
1,034.04 |
780.32 |
|
Other Current Liabilities |
89.55 |
122.34 |
114.73 |
120.92 |
|
Provisions |
19.79 |
21.59 |
24.96 |
42.69 |
|
Current Tax Liabilities |
10.97 |
8.67 |
25.02 |
13.74 |
|
Total Current Liabilities |
1,300.71 |
1,614.73 |
2,434.71 |
2,325.03 |
|
|
||||
|
Total Equity & Liabilities |
5,914.51 |
6,535.70 |
8,830.42 |
9,515.62 |
Pidilite Industries Limited - Industry Overview
-
Construction Industry
-
The construction industry in India consists of the real estate as well as the urban development segment.
-
The real estate segment covers residential, office, retail, hotels, and leisure parks among others.
-
While the urban development segment broadly consists of sub-segments such as water supply, sanitation, urban transport, schools, and healthcare.
-
FDI in the construction development sector (township, housing, built-up infrastructure, and development sector) and construction (infrastructure) activities stood at $27.97 billion and $26.20 billion, respectively, between April 2000 and March 2022.
-
The construction industry in India is expected to reach $1.4 trillion by 2025.
-
The construction industry market in India works across 250 sub-sectors with linkages across sectors.
-
-
Specialty Chemical Sector
-
India’s high-value specialty chemical segment caters to agrochemicals, dye, food, and fragrance applications.
-
The specialty chemical segment will out-space Chinese companies and double its global market share from 3% in FY 2021 to 6% in FY 2026.
-
Demand for specialty chemicals is triggered by the rise in exports due to the shift in global supply chains driven by China and demand recovery in domestic segments.
-
China is losing its competitive edge due to increasing environmental costs and reduced government shops.
-
Concall Overview (Q4FY2022)
-
Demand in Q4FY2022 was subdued due to a few challenges such as omicron, supply chain challenges, and shop closure.
-
The management expects demand pick-up in the FY2023 led by a good monsoon, revival in the real estate industry, and higher government cape.
-
The company has taken 5%-15% price hikes so far and is closely watching the industry trends to take further price hikes, which will help to mitigate higher input costs.
-
The company added 10 new facilities in the last 2 years and 12 facilities are under construction. The CAPEX is planned to be 3%-5% of sales annually. Innovation is expected in both the growth and core categories, and the company plans to launch one new product in each category in the next 12-18 months.
Pidilite Industries Limited - Technical Analysis
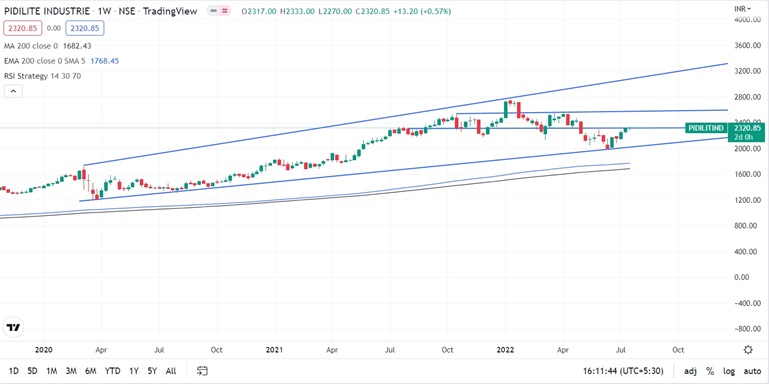
-
Stock is trading above EMA 200 and MA 200 indicators, with a strong support level of ₹2,300 and a resistance level at ₹2,550.
-
One can accumulate this share at the current price.
Recommendation Rationale
-
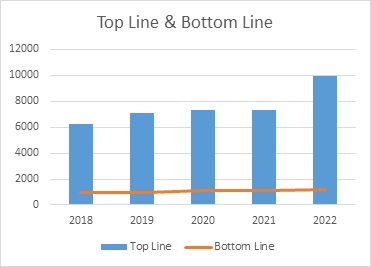
In FY 2022, Pidilite Industries Limited’s revenue increased by 36.04% to ₹9,920.96 crores, compared to the previous year at ₹7,292.71. Profit After Tax increased by 7.16% to ₹1,206.76 crores compared to the last year at ₹1,126.13 crores.
-
The company is the largest player in the consumer adhesive and sealant industry.
-
Pidilite has a 70% market share in the adhesive business in India.
-
Having a well-established brand and the ability to customize the product portfolio provide the company with a competitive edge over an unorganized player.
-
The company has a healthy financial risk profile.
-
The company is net-debt free.
-
The company’s overseas subsidiaries have also given modest performance in FY 2022.
-
The company has seen higher than industry growth due to its strong brand equity, focus on innovation, and increase in distributor reach.
-
The company’s operating performance will remain strong due to business expansion plans, experience management, strong financial position, and brand image.
Valuation
-
The company’s revenue has increased at a CAGR of 12% from FY 2018-2022.
-
The company has sustained healthy revenue growth and profit margins on a consolidated basis over the years with a consistent focus on quality, a diversified distribution network, and an innovative marketing style.
-
The company’s ROE and ROCE are 20% and 24%.
-
The company could face challenges like volatility in prices of raw materials and increased prices of crude oil.
-
We have taken data for the last five years (2018-2022) and forecasted revenue for FY 2023-2027. Revenue growth is assumed to be 13%.
Estimated Income Statement (₹ in crores)
|
|
Mar-23 |
Mar-24 |
Mar-25 |
Mar-26 |
Mar-27 |
|
|
2023-E |
2024-E |
2025-E |
2026-E |
2027-E |
|
Revenue |
11,189.71 |
12,574.72 |
14,131.18 |
15,880.33 |
17,846.01 |
|
COGS |
5,797.88 |
6,516.01 |
7,323.09 |
8,230.13 |
9,249.52 |
|
Gross Profit |
5,391.82 |
6,058.70 |
6,808.09 |
7,650.19 |
8,596.48 |
|
Employee Expenses |
1,374.88 |
1,545.18 |
1,736.56 |
1,951.66 |
2,193.39 |
|
Power and Fuel Expense |
1,811.57 |
2,035.95 |
2,288.12 |
2,571.53 |
2,890.04 |
|
Other Expenses |
2,205.37 |
2,477.58 |
2,783.41 |
3,127.01 |
3,513.05 |
|
EBITDA |
258.17 |
270.01 |
284.83 |
302.90 |
324.52 |
|
Depreciation |
1,947.20 |
2,207.57 |
2,498.57 |
2,824.10 |
3,188.54 |
|
EBIT |
1,947.20 |
2,207.57 |
2,498.57 |
2,824.10 |
3,188.54 |
|
Financial Cost |
49.84 |
56.51 |
63.95 |
72.29 |
81.62 |
|
EBT |
1,897.36 |
2,151.07 |
2,434.62 |
2,751.82 |
3,106.92 |
|
Tax expenses |
474.34 |
537.77 |
608.65 |
687.95 |
776.73 |
|
PAT |
1,423.02 |
1,613.30 |
1,825.96 |
2,063.86 |
2,330.19 |
-
We initiate coverage on Pidilite Industries Limited with a “BUY” and a 2-years Target Price of 3,266.
Disclaimer: This report is only for the information of our customers. Recommendations, opinions, or suggestions are given with the understanding that readers acting on this information assume all risks involved. The information provided herein is not to be construed as an offer to buy or sell securities of any kind.
- Share :


Post a Comment
|
DISCLAIMER |
This report is only for the information of our customers. Recommendations, opinions, or suggestions are given with the understanding that readers acting on this information assume all risks involved. The information provided herein is not to be construed as an offer to buy or sell securities of any kind. ATS and/or its group companies do not as assume any responsibility or liability resulting from the use of such information.