Manappuram Finance Limited Research Report
|
Industry |
Market Price |
Recommendation |
Target |
Time Horizon |
|
NBFC |
90.80 |
Buy |
127 |
1 Year |
Q4 FY 2022 Review
Manappuram Finance limited reported net revenue of ₹1,481.35 crores for the quarter ended March 31, 2022, compared to ₹1,622.32 croresfor March 31, 2021.Profit After Tax was ₹260.95 croresfor the quarter ended March 31, 2022, as compared to ₹468.35 crores, during the corresponding quarter of the previous year respectively.
Manappuram Finance Limited - Investment Summary
|
CMP (₹) |
90.80 |
|
52 Week H/L |
88.1/224.5 |
|
Market Cap (crores) |
₹7,685 |
|
Face Value (₹) |
2.00 |
|
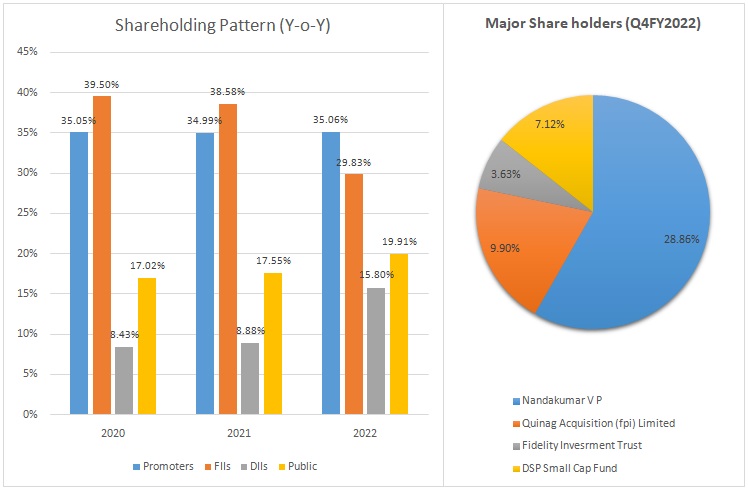
Promoter Holding (%) |
35.06 |
|
Non-Promoter Holding (%) |
64.94 |
|
Total (%) |
100.00 |
|
Book Value |
₹98 |
|
EPS TTM |
₹15.70 |
Overview
-
Manappuram Finance Limited has 5,000 branches with an employee strength of more than 40,000 on a consolidated basis.
-
Manappuram was the first company to start online gold lending in FY 2015.
-
It is the second-largest listed player in the gold loan segment with a consolidated AUM of ₹303 billion.
-
The Board of directors has declared a dividend of ₹0.75 per share for FY 2022.
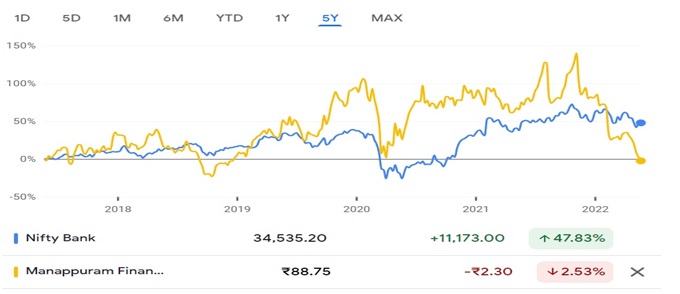
Beta: 1.05 |
Alpha:-19.45 |
Risk Reward Ratio: 1.73 |
Margin of Safety: 26% |
Manappuram Finance Limited - Quarterly Summary
|
Quarterly (INR in crores) |
Mar-22 |
Dec-21 |
Sep-21 |
Jun-21 |
Mar-21 |
|
Income from Operations |
1,481.35 |
1,484.45 |
1531.92 |
1563.3 |
1,622.32 |
|
Finance costs |
494.83 |
531.07 |
492.37 |
493.1 |
523.92 |
|
Net Interest Income |
986.52 |
953.38 |
1,039.55 |
1,070.20 |
1,098.40 |
|
|
|
|
|
|
|
|
Other Income |
9.96 |
22.4 |
22.5 |
10.44 |
7.93 |
|
Total Income |
996.48 |
975.78 |
1,062.05 |
1,080.64 |
1,106.33 |
|
|
|
|
|
|
|
|
Fees and Commission Expenses |
4.27 |
7.74 |
4.76 |
9.25 |
8.22 |
|
Impairment on Financial Instruments |
151.37 |
104.78 |
107.77 |
122.25 |
106.59 |
|
Employee Benefits Expenses |
301.08 |
305.68 |
287.8 |
230.45 |
233.44 |
|
Depreciation and Amoritzation |
58.14 |
55.65 |
41.41 |
42.78 |
43.93 |
|
Other Expenses |
127.68 |
153.75 |
125.28 |
89.54 |
92.07 |
|
EBT |
353.94 |
348.18 |
495.03 |
586.37 |
622.08 |
|
|
|
|
|
|
|
|
Tax Expenses |
92.99 |
87.17 |
125.15 |
149.42 |
153.73 |
|
PAT |
260.95 |
261.01 |
369.88 |
436.95 |
468.35 |
Business
-
Manappuram Finance Limited was incorporated on July 15, 1992, in Thrissur, Kerala.
-
The company is a non-deposit-taking Non-Banking Finance Company.
-
The company provides a wide range of fund-based and fee-based services including goal loans, money exchange facilities, etc.
-
The company has four subsidiaries: Manappuram Home Finance Limited, Manappuram Insurance Brokers Limited, Asirvad Microfinance Limited, and Manappuram Comptech and Consultants Limited.
-
In the past three years, the manappuram group has diversified into other businesses such as microfinance, Vehicle Finance, loan against property and affordable housing finance, and insurance business.
-
Business segment updates (Q4FY2022):
-
Gold Loan Business:
-
Gold loan AUM stood at ₹202 billion decreased by 1.4% Q-o-Q basis and increased by 5.7% Y-o-Y basis.
-
Gold Holdings stood at 68 tons down by 2.9% Q-o-Q basis and up by 4% Y-o-Y basis.
-
PAT for FY 2022 was ₹1,304 crores.
-
-
Micro Finance Business (MFI):
-
Asirvad Microfinance Limited’s AUM stands at ₹7,002 crores, down by 1.2% Q-o-Q basis and up by 1.7% Y-o-Y basis.
-
Collection efficiency from MFI business in Q4FY2022 stood at 99% and disbursement during the quarter was ₹1,124 crores.
-
-
Vehicle Finance Business:
-
The Company reported an AUM of ₹1,643 crores, up by 8.8% & 56.1% Q-o-Q and Y-o-Y basis.
-
Collection efficiency for the quarter was 104% as compared to 103% in Q3FY2022.
-
-
Home Loan Business:
-
Its total AUM was ₹845 crores, up by 3.5% & 26.91% Q-o-Q and Y-o-Y basis.
-
Collection efficiency for the Q4FY2022 was 109%, compared to 100% in Q3FY2022.
-
It operates from 73 branches and reported a profit of ₹7.2 crores during the year.
-
-
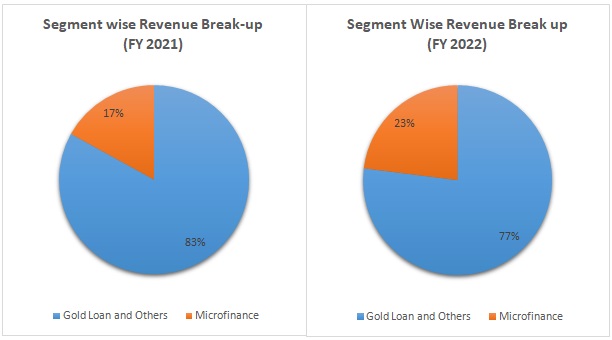
-
Out of the total revenue, 77% has been generated from Gold & others, and 23% from Microfinance in FY 2022 compared to 83% and 17% in FY 2021, respectively.
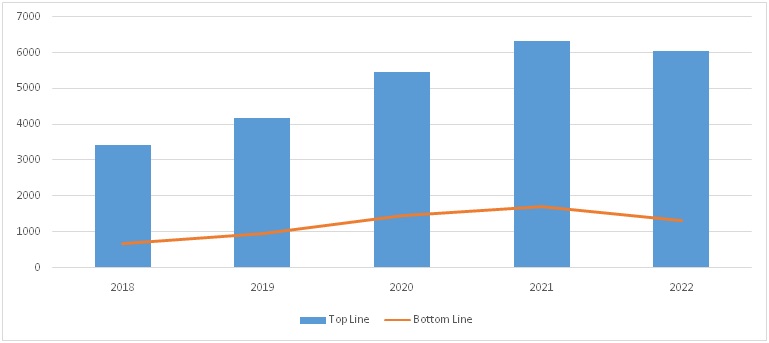
Manappuram Finance Limited - Revenue Trend
Topline and Bottomline trend (crores)
Manappuram Finance Limited - Ratio Analysis
|
|
Mar-18 |
Mar-19 |
Mar-20 |
Mar-21 |
Mar-22 |
|
ROE |
18% |
23% |
28% |
26% |
17% |
|
ROA |
1.79% |
1.84% |
2.46% |
4.09% |
4% |
|
Capital Adequacy Ratio |
26.98% |
23.27% |
21.41% |
29.02% |
31% |
|
Net Yield |
24.01% |
23.28% |
25.30% |
24.92% |
20.70% |
|
GNPA |
0.69% |
0.55% |
0.88% |
1.92% |
3% |
|
NNPA |
0.33% |
0.32% |
0.47% |
1.53% |
2.70% |
Manappuram Finance Limited - Financial Overview
Manappuram Finance Limited - Profit and Loss Statement (₹ in crores)
|
|
2018 |
2019 |
2020 |
2021 |
2022 |
|
Interest Income |
3,354 |
4,046 |
5,280 |
6,190 |
5,840 |
|
Dividend Income |
2 |
5 |
9 |
13 |
11 |
|
Fees And Commission Income |
59 |
84 |
31 |
18 |
23 |
|
Net Gain on Fair Value Changes |
1 |
30 |
126 |
71 |
117 |
|
Other Operating Income |
5 |
15 |
19 |
39 |
70 |
|
Total Revenue from Operations |
3,421 |
4,180 |
5,465 |
6,331 |
6,061 |
|
|
|
|
|
|
|
|
Finance Cost |
1,030 |
1,345 |
1,832 |
2,219 |
2,011 |
|
Net Interest Income |
2,390 |
2,835 |
3,633 |
4,112 |
4,050 |
|
|
|
|
|
|
|
|
Other Income |
58 |
63 |
86 |
44 |
65 |
|
Total Income |
2,449 |
2,897 |
3,719 |
4,156 |
4,115 |
|
|
|
|
|
|
|
|
Fees And Commission Expenses |
13 |
20 |
24 |
20 |
26 |
|
Impairment on Financial Instrument |
177 |
55 |
238 |
440 |
486 |
|
Employees Benefits Expenses |
626 |
720 |
830 |
843 |
1,125 |
|
Other Expenses |
528 |
571 |
456 |
366 |
496 |
|
Depreciation, Amortisation And Impairment |
68 |
75 |
164 |
171 |
198 |
|
EBT |
1,037 |
1,457 |
2,007 |
2,316 |
1,784 |
|
|
|
|
|
|
|
|
Tax Expenses |
361 |
508 |
527 |
591 |
455 |
|
PAT |
676 |
949 |
1,480 |
1,725 |
1,329 |
|
|
|
|
|
|
|
|
EPS |
|
|
|
|
|
|
Basic |
8 |
11 |
18 |
20 |
85 |
|
Diluted |
8 |
11 |
17 |
20 |
85 |
|
|
|
|
|
|
|
|
Number Of Shares |
|
|
|
|
|
|
Basic |
84 |
84 |
84 |
85 |
16 |
|
Diluted |
84 |
84 |
85 |
85 |
16 |
Cash Flow Statement (₹ in crores)
|
|
Mar-18 |
Mar-19 |
Mar-20 |
Mar-21 |
|
Net Profit Before Tax |
1,037 |
1,457 |
2,007 |
2,316 |
|
Net Cash from Operating Activities |
-33 |
-1,661 |
-3,620 |
-619 |
|
Net Cash Used for Investing Activities |
-148 |
-371 |
26 |
-186 |
|
Net Cash From (Used For) Financing Activities |
293 |
2,388 |
6,049 |
59 |
|
Net Increase in Cash and Cash Equivalents |
112 |
356 |
2,455 |
-747 |
|
Cash And Cash Equivalents at The Beginning of the Year |
373 |
484 |
840 |
3,296 |
|
Cash And Cash Equivalents at The End of the Year |
484 |
840 |
3,296 |
2,548 |
Manappuram Finance Limited -Balance Sheet (₹ in crores)
|
|
2018 |
2019 |
2020 |
2021 |
2022 |
|
Assets: - |
|
|
|
|
|
|
Financial Assets |
|
|
|
|
|
|
Cash and Cash Equivalents |
484.28 |
840.38 |
3295.52 |
2548.21 |
2370.75 |
|
Bank Balance Other Than Above |
239.84 |
323.82 |
371.25 |
364.21 |
326.58 |
|
Derivative Financial Instruments |
- |
3.231 |
136.997 |
- |
- |
|
Receivables |
1.088 |
2.713 |
2.477 |
- |
2.74 |
|
Loans |
15243.87 |
17810.01 |
24297.08 |
26507.61 |
28971.05 |
|
Investments |
4.925 |
173.755 |
90.483 |
338.011 |
420.7 |
|
Other Financial Assets |
456.945 |
607.579 |
263.024 |
365.57 |
330.16 |
|
Total Financial Assets |
16430.95 |
19761.48 |
28456.84 |
30123.61 |
32421.98 |
|
|
|||||
|
Non-Financial Assets: |
|||||
|
Current Tax Assets (Net) |
106 |
169 |
96 |
20 |
92 |
|
Deferred Tax Assets (Net) |
109.825 |
77.059 |
101.357 |
185.454 |
174.03 |
|
Investment Property |
0.085 |
0.086 |
0.086 |
0.086 |
0.09 |
|
Property, Plants and Equipment |
268.656 |
312.473 |
327.22 |
286.65 |
353.17 |
|
Capital WIP |
0.147 |
0.89 |
3.461 |
7.507 |
13.03 |
|
Right Of Use Assets |
0 |
0 |
419 |
576 |
637 |
|
Goodwill |
36 |
36 |
36 |
36 |
36 |
|
Other Intangible Assets |
6 |
18 |
21 |
28 |
26 |
|
Other Non-Financial Assets |
73 |
70 |
75 |
75 |
57 |
|
Total Non-Financial Assets |
599 |
684 |
1,078 |
1,214 |
1,389 |
|
|
|||||
|
Total Assets |
17029.61 |
20445.68 |
29535.08 |
31337.78 |
33810.55 |
|
|
|||||
|
Equities & Liabilities |
|||||
|
Equity |
|||||
|
Equity Share Capital |
169 |
169 |
169 |
169 |
169 |
|
Other Equity |
3,645 |
4,378 |
5,577 |
7,138 |
8,199 |
|
Non-Controlling Interest |
29 |
46 |
58 |
47 |
16 |
|
Total Equity |
3,842 |
4,593 |
5,804 |
7,355 |
8,384 |
|
|
|||||
|
Financial Liabilities |
|||||
|
Derivative Financial Instruments |
7 |
- |
- |
36 |
30 |
|
Trade Payables |
0 |
0 |
0 |
0 |
0 |
|
Total Outstanding Dues of Micro Enterprises and Small Enterprises |
- |
0 |
- |
0 |
- |
|
Other Creditors |
118.155 |
132.626 |
108.894 |
124.172 |
141.63 |
|
Debt Securities |
5429.544 |
5598.653 |
8055.504 |
11282.4 |
9321.83 |
|
Borrowings (Other than Debt Securities) |
7057.557 |
9577.084 |
14394.63 |
11214.21 |
14476.78 |
|
Deposits |
- |
1.92 |
0.01 |
0.07 |
0.07 |
|
Subordinated Liabilities |
119.955 |
119.588 |
123.377 |
219.579 |
319.8 |
|
Lease Liability |
0 |
0 |
448.654 |
600.532 |
697.99 |
|
Other Financial Liabilities |
353.711 |
273.04 |
193.227 |
338.478 |
250.09 |
|
Total Financial Liabilities |
13,086 |
15,703 |
23,324 |
23,815 |
25,238 |
|
|
|||||
|
Non-Financial Liabilities |
|||||
|
Provisions |
44.962 |
54.767 |
72.315 |
71.894 |
72.79 |
|
Deferred Tax Liabilities (Net) |
0 |
0 |
0 |
0 |
- |
|
Other Non-Financial Liabilities |
56.668 |
95.453 |
334.08 |
95.798 |
114.99 |
|
Total Non-Financial Liabilities |
101.63 |
150.22 |
406.395 |
167.692 |
187.78 |
|
|
|||||
|
Total Equities & Liabilities |
17,029.61 |
20,445.68 |
29,535.08 |
31,337.78 |
33,810.55 |
Industry Overview
-
Financial Service Industry:
-
India has a diversified sector undergoing rapid expansion, both in terms of strong growth of existing financial service firms and new entities entering the market.
-
The sector comprises commercial banks, insurance companies, non-banking financial companies, pension funds, mutual funds, and other smaller entities.
-
The banking regular allowed new entities such as payment banks to be created recently, they're adding to the type of entities operating in the sector. However financial sector with commercial banks accounting for more than 64% of the total assets held by the financial system.
-
India is expected to be the 4th largest private wealth globally by 2028.
-
-
NBFC Industry:
-
NBFC plays a critical role in financial intermediation and promoting inclusive growth by providing last-mile access to financial services to meet the diversified financial needs of the under-banked customer.
-
NBFC has to face liquidity challenges following the default by Infrastructure Leasing & Financial Services Limited in FY 2019 and was dealt a second blow when the covid-19 pandemic stuck.
-
After facing challenges over the past few years, NBFCs in India could see normalization of business activities and grow their loan book by 8%-10% year-on-year basis in FY 2023.
-
Customized product offerings, the introduction of a scale-based regulatory framework for NBFCs by RBI, and higher loan-to-value are some of the growth drivers for NBFCs.
-
-
Gold Loan Industry:
-
The Asset Under Management of gold loan NBFCs is expected to rise 10%-12% in FY 2022-23, On the back of buoyancy in the gold prices and limited borrowing avenues for a selected customer segment.
-
Even though banks are targeting the gold loan segment aggressively, NBFCs are expected to remain key players in this segment due to their pan-India presence, the ability to facilitate the transaction in a very period, and hassle-free process.
-
The circular from RBI released on November 12, 2021 on the up-gradation of bad loans is likely to have a minimal impact on gold loan NBFCs. This is on account such entities have a bullet repayment system.
-
Concall Overview (Q4FY2022)
-
Goal loans above two lakhs ticket size constituted 33% of the AUM.
-
The blended disbursement yield in gold finance is 21%, and the company would look to maintain these yields. Few players have already increased the lending rates and the market will gradually overcome the reasonable price war.
-
Guided for targeted ROA 5% and ROE 20%.
-
The management expects gold loan growth to pick up from June 2022. It expects gold loan growth of 10% and consolidated AUM growth of 15% in FY 2023.
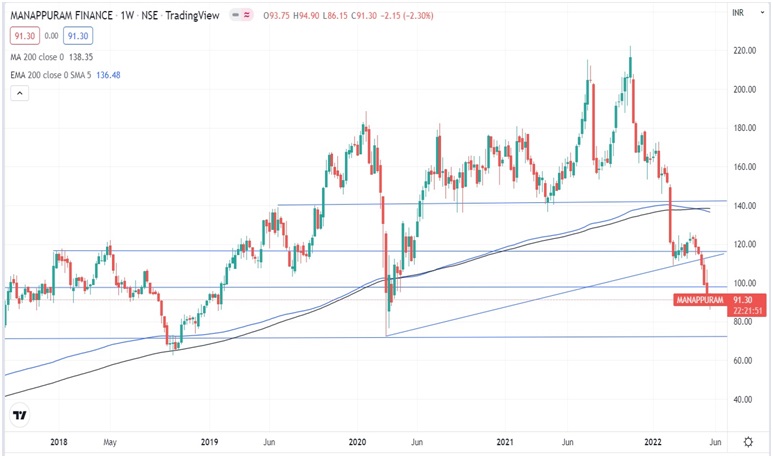
Manappuram Finance Limited - Technical Analysis
-
Stock is trading belowEMA 200 and MA 200indicators, with a strong support level of ₹98and a resistance level of ₹143.
-
Share is consolidating at the current level and can break out once it crosses the level of ₹98.
Recommendation Rationale:
-
Manappuram Financial Limited has a well-established track record of operations for more than 25 years in the gold loan financing segment and has consequently established a brand image in the market.
-
Experience promoters and management, as they have been in this business for more than six decades.
-
It is the second-largest gold loan NBFC in India
-
The consistent efforts in advertising and branding have increased its brand call significantly.
-
The company has a fairly diversified fund profile, with access to funding from banks and market instruments like NCDs and Commercial Paper.
-
The company has put in place adequate risk management systems.
-
The ROA and ROE are 4.1% and 16.9% for FY 2022.
-
The Company is well capitalized with a capital adequacy ratio of 31%.
-
The decrease in Covid-19 cases, recovery in the economy, and improvement in the performance of the overall business will lead to improvement in the asset quality of the company. The company has set a target of 20% ROE for FY 2023.
Valuation
-
The Company’s Net Interest Income has increased at a CAGR of14 % from FY 2019 to 2022
-
The company result for FY 2022 was impacted due to covid-19, an increase in competition, and slow recovery in economics.
-
Company has shown good growth in terms revenue and profit from FY 2017 to FY 2021.
-
The company is expecting gold loan growth to pick-up from June FY 2022.
-
we expect the company could post higher Net Interest income for the FY 2023, corresponding to the previous year.
-
We have taken data for the last five years (2018-2022) and forecasted revenue for FY 2023-2026. Revenue growth is assumed to be10%.
Estimated Income Statement (₹ incrores):
|
|
Mar-23 |
Mar-24 |
Mar-25 |
Mar-26 |
|
|
2023-E |
2024-E |
2025-E |
2026-E |
|
Total Revenue from operations |
6,667 |
7,334 |
8,067 |
8,874 |
|
|
||||
|
Finance cost |
2,275 |
2,502 |
2,752 |
3,028 |
|
Net Interest Income |
4,392 |
4,832 |
5,315 |
5,846 |
|
|
||||
|
Other income |
72 |
79 |
87 |
96 |
|
Total Income |
4,464 |
4,911 |
5,402 |
5,942 |
|
|
||||
|
Fees and Commission Expenses |
24.94 |
27.43 |
30.17 |
33.19 |
|
Impairment on Financial Instrument |
499.13 |
549.05 |
603.95 |
664.35 |
|
Employees Benefits Expenses |
1062.62 |
1265.07 |
1338.67 |
1501.64 |
|
Other Expenses |
465.42 |
511.96 |
563.16 |
619.47 |
|
Depreciation, Amortisation and Impairment |
217.78 |
239.56 |
263.51 |
289.86 |
|
EBT |
2,194 |
2,318 |
2,602 |
2,833 |
|
|
||||
|
Tax Expenses |
548.59 |
579.40 |
650.57 |
708.35 |
|
PAT |
1,646 |
1,738 |
1,952 |
2,125 |
-
We initiate coverage on Manappuram Finance Limited with a “BUY” and a 1-year Target Price of ₹ 127.
Disclaimer: This report is only for the information of our customers Recommendations, opinions, or suggestions are given with the understanding that readers acting on this information assume all risks involved. The information provided herein is not to be construed as an offer to buy or sell securities of any kind.
- Share :


Post a Comment
|
DISCLAIMER |
This report is only for the information of our customers. Recommendations, opinions, or suggestions are given with the understanding that readers acting on this information assume all risks involved. The information provided herein is not to be construed as an offer to buy or sell securities of any kind. ATS and/or its group companies do not as assume any responsibility or liability resulting from the use of such information.