Lupin ltd
|
Industry |
Market Price |
Recommendation |
Target |
Time Horizon |
|
Pharmaceuticals |
904.30 |
Buy |
1085.60 |
12 Months |
Lupin is a fully integrated pharmaceutical company established in 1968 catering to a generic pharma market globally. With an unrivaled position in the US, India and Japan, Lupin has gone on to be the 4th Largest generic pharmaceutical company in the world by Market Capitalization. This position has been built on the backbone of a cutting-edge research, world-class manufacturing facilities and a well-established global supply chain.
Lupin Limited - Investment Summary
|
CMP (Rs) |
40,724.31 |
|
52 Week H/L |
986.00 /723.55 |
|
Market Cap (Cr) |
40,724.31 |
|
Face Value (Rs) |
2.00 |
|
Promoter Holding (%) |
50.70 |
|
Non-Promoter Holding (%) |
49.30 |
|
Total (%) |
100.00 |
-
Ranked No. 4 in the prescription generic market in South Africa.
-
Recent approvals have increasing the investors’ interest.
-
Research & Development (R&D).
-
Sales Increased in domestic market.
Lupin Limited - Financial Summary
|
Particulars(Rs. Cr) |
FY18 |
FY17 |
FY16 |
FY15 |
FY14 |
|
Total Assets |
18,681.00 |
17,848.24 |
14,236.14 |
11,007.71 |
8,798.96 |
|
Total Revenue |
10,211.70 |
12,714.67 |
11,406.69 |
9,933.10 |
9,354.76 |
|
Profit after Tax |
1,344.66 |
3,141.33 |
2,830.87 |
2,397.35 |
2,324.2 |
|
EPS( Rs) |
29.76 |
69.63 |
62.92 |
53.00 |
51.88 |
Lupin Limited - Outlook and Valuation
Lupin’s September (Q2) revenues meet estimates. However, Strong forex tailwind and lower R&D costs led to an EBITDA growth of 2%, however PAT was 5% lower than estimated. US revenues continue to surge due to volume gains in Fortamet/Glumetza. Partial US recovery is expected from 2nd half of FY19, though the strength and sustainability of the recovery is contingent on levothyroxine dynamics as well as Solosec penetration. Forex gains combined with growth in US sales will improve margins and efficiency. Recently, Lupin has received an observation in the establishment inspection report given by the US health regulator for its Tarapur facility in Maharashtra and also received approvals from the US health regulator for its Clomipramine Hydrochloride capsules, and Potassium Chloride for oral solution. Considering all the point, we recommend “Buy” for this stock for long term.
Lupin Limited - Management Profile
|
Key Personnel |
Designation and Experience |
Auditors |
|
Mrs. Manju Gupta |
Chairman: Mrs. Manju Deshbandu Gupta serves as Chairman of the Lupin Limited board. Mrs. Gupta is a graduate in arts, She is the wife of DBG and also one of the promoters of the company having a wide range of business experience. |
Walker Chandiok & Co LLP |
|
Ms. Vinita Gupta |
Chief Executive Officer and Executive Director: Ms. Vinita Gupta is the Chief Executive Officer and Executive Director of Lupin Limited. She graduated in pharmacy from University of Mumbai and completed her MBA from J L Kellogg Graduate School of Management, USA. Ms. Vinita Gupta has been an instrumental part in Lupin's forays into the Advanced Markets and she heads the Advanced Market business of Lupin in of USA and Europe. Under her leadership, Lupin has emerged as an Undisputed global generic player, especially in the American market in addition to being a strong player in the pediatric market. She is also a CEO of Lupin Limited and on the Board of Lupin Ltd. |
Mr D. H. Zaveri |
|
Mr. Nilesh Gupta |
Managing Director, Executive Director: Mr. Nilesh Gupta is the Managing Director, Executive Director of Lupin Limited. Mr. Nilesh Gupta is a chemical engineering graduate from UDCT, Mumbai, and did his mba from the Wharton School, U.S.A. Mr. Gupta had showcased exemplary performance in integrating and leading the diversified portfolio of Lupin Ltd and ably contributing to the growth of the Company. He directed the Intellectual Property strategy of Lupin towards achieving a top position for branded products. .
|
Mr Deepak Viegas |
|
Dr. Kamal Sharma |
Non-Executive Vice Chairman: Dr. Kamal K. Sharma serves as the Non-Executive Vice Chairman of the Board on Lupin. Dr. Kamal K. Sharma is a undergraduate in chemical engineering from the Indian institute of Technology (IIT), Kanpur, with a PGDM in industrial management from Jamnalal Bajaj Institute of management Studies, Mumbai, and a Ph.D in economics from IIT, Mumbai. He has also done a senior management program from Harvard Business School, Boston, USA. In a career of over 30 years, Dr. |
|
Lupin Limited - Company overview:
Lupin, founded by Desh Bandhu Gupta in 1968, then an Associate Professor at Birla Institute of Technology and Science - Pilani, Rajasthan. Gupta passed away on 26 June 2017 and was succeeded as chairman by his wife, Manju Deshbandhu Gupta. Lupin gained recognition when it became one of the world’s largest manufacturers of tuberculosis (TB) drugs. Lupin today has a significant market share in USA, Japan and Europe in the cardiovascular prils and statins, Diabetology, asthma, pediatrics, CNS, GI, anti-infectives and NSAIDs therapy segments. Lupin also has a global leadership position in the anti-TB and Cephalosporinsegments.
Lupin’s entry into advanced drug delivery systems has resulted in the advancement of platform technologies that are being utilized to develop various generic pharmaceuticals. The company’s manufacturing facilities are spread across India and Japan, and have played a critical role in enabling the company to realize its global aspirations. Of International standards, these facilities are approved by international regulatory agencies including US-FDA, UK-MHRA, Japan’s MHLW, TGA Australia, WHO, and the MCC South Africa.
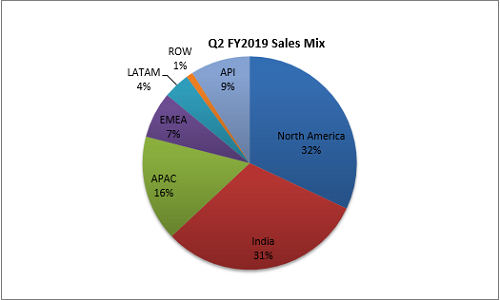
Lupin’s business covers the entire pharma value chain, ranging from branded and generic formulas, APIs, advanced drug delivery systems to biotechnology. The company’s drugs reach around 70 countries with a footprint that covers global markets such as USA, Europe, Japan, Australia as well as many emerging markets including India, Philippines and South Africa to name a few. In Q2 FY2019, sales from North America have been decreased around 6%, Indian market, company has played well and compare to last year, their sales has increased by 4% and also 2% increase in API.
Key Ratios
|
Key Ratios |
FY18 |
FY17 |
FY16 |
FY15 |
FY14 |
|
Debt-Equity Ratio |
0.00 |
0.04 |
0.03 |
0.00 |
0.02 |
|
Current Ratio |
3.73 |
3.61 |
3.71 |
3.89 |
3.45 |
|
Inventory Turnover Ratio (x) |
4.62 |
5.94 |
5.86 |
5.61 |
6.51 |
|
Total Asset Turnover Ratio (%) |
53.96 |
70.74 |
78.81 |
88.59 |
101.59 |
|
PBDIT Margin (%) |
21.99 |
36.23 |
37.20 |
36.44 |
37.22 |
|
PBIT Margin (%) |
18.12 |
33.33 |
34.47 |
32.98 |
35.35 |
|
ROCE (%) |
11.17 |
27.53 |
23.05 |
25.64 |
31.67 |
|
RONW (%) |
8.51 |
21.25 |
23.76 |
26.55 |
33.30 |
|
Payout (%) |
25.19 |
10.76 |
11.90 |
14.06 |
11.57 |
|
Price/Book Value (x) |
2.11 |
4.41 |
5.60 |
9.99 |
6.01 |
|
EV/EBITDA (x) |
14.97 |
14.35 |
16.06 |
25.38 |
12.61 |
|
Market Cap/Sales |
3.30 |
5.17 |
5.94 |
9.25 |
4.69 |
Lupin Limited - Investment Rationale
-
Ranked No. 4 in the prescription generic market in South Africa.
Lupin's South African subsidiary, Pharma Dynamics is the fastest growing and the fourth largest generic company in the South African market. The company is a market leader in the cardiovascular segment and has a growing presence in Neurology, Gastroenterology and the Over the Counter segments. In Q2FY19 revenues grew 5% year-on-year (YoY) to ZAR 283 mn, trading in the local currency terms (Rand) and Rand depreciation impacted positively. In addition, it is now ranked No. 4 in the prescription generic market in South Africa.
-
Recent approvals have increasing the investors’ interest.
Recently, Lupin has received an observation in the establishment inspection report given by the US health regulator for its Tarapur facility in Maharashtra and also received approvals from the US health regulator for its Clomipramine Hydrochloride capsules, and Potassium Chloride for oral solution. As on 30th Oct, 2018, Lupin had cumulative pipeline of 405 ANDAs of which 249 ANDAs are approved, 158 pending and 39 pending US First to Files.
-
Sales Increased in domestic market.
Lupin in the domestic market has shown rapid growth in the last two quarters. In the last year, the company has covered 26% of their revenue from the Indian market, but in Q2 FY2018 their sales have been increased to INR 12,032 mn, almost 5 % growth can be seen in the domestic market. India business maintained outperformance with 14.5% growth in H1FY19 (vs 12.1% for IPM)
-
Research & Development (R&D).
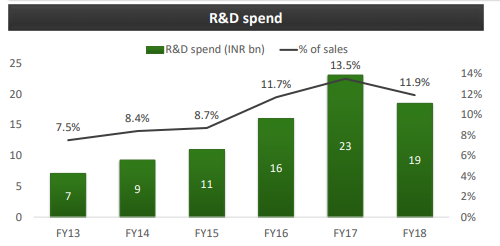
From the last two years, Lupin has invested a good amount of their revenue in Research and Development has helped them to gain a leadership position in differentiated product introductions. The company mainly focuses on continuous to be Complex Generics, Biotechnology, and Novel Drug Discovery and Development. Spread across 9 R&D sites in 6 countries, with over 1,700 scientists and more than 3,000 patents filed globally, they are well positioned to cater to the unique requirements of distinct markets. In FY18, Lupin decreased their investment in R&D by 1.6% of their revenue which led to an EBITDA growth of 2%.
Industry Overview
Indian Pharma industry contributes over 4% of Indian GDP. There are close to half a million people directly, over a million people indirectly employed in Indian Pharmaceutical industry making India as second highest skilled biotech workforce in the world. Between 2000 -2017, FDI investment in this sector is over US$ 16 billion. India’s pharma export 2017-18 is over 16 Billion USD. Present government aims to make India a major hub for end-to-end drug discovery through initiatives such as ‘Pharma Vision 2020’.
Where most of the sales come from US and European Markets followed by Asian countries, Indian Pharma companies contribute to over 20% of Global Generic business. Thanks to pricing pressures from governments, Indian Domestic Pharma Market which makes up of 10% of global sales account only for 3% in value terms. World medical spending is expected to grow by 3-6% CAGR to USD 1.4 Trillion from current 1.13 Trillion by 2022.
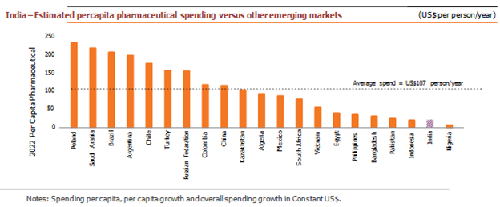
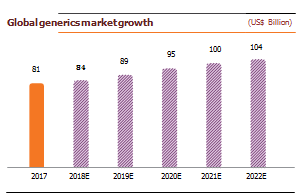
India exports 20% of World Generic, cost of producing drugs is 33% lower in India than US due to lower labor and production plant set up cost. Generic drugs are low-priced copies of off-patent medicines. They serve a critical purpose in healthcare provision: allowing cheap competition to older medicines frees up resources to pay for newer, innovative treatments. Generics drugs have made it possible to reduce the total cost of care as they cost 75-90% less than their branded equivalents. The global generic drugs market reached ~US$ 245 billion in 2017. The use of generics saved the US healthcare system an amount of US$253 billion during 2016 and US$1.67 trillion over the last decade. Generic drugs make up >80% of the volume of drugs dispensed around the world, and the volume is expected to grow as more drugs lose patent protection. The global generic drugs market was pegged at US$185 billion in 2016, 17% of the global pharmaceutical market. Generic drugs accounted for 28% of the total pharmaceutical sales worldwide in 2017. Additionally, there were 847 generics approved in 2017, up by 37% from the previous record (633) in 2016 as well as 73 unique ANDAs approved during the same period.
Demand drives as the elderly population rises around the world, the need for multiple drugs increase. This could cause volumes to rise faster than the population growth as well as put a greater pressure on costs. Healthcare costs have risen consistently as a share of GDP in all developed countries and are expected to keep rising. In the US, healthcare expenditure increased to US$ 3 trillion in 2015 and is forecast to reach 20% of the GDP by 2025. As expenditure in developing countries catches up with the developed world, a greater share of these expenses is being borne by governments, pressuring budgets. While a number of factors drive rising healthcare costs and drugs account for only 10-15% of healthcare spending in most countries, pressure on healthcare budgets is unlikely to ease. The increasing focus on value in healthcare provision and greater price sensitivity from patients, could support generics demand.
At about 4.5% of the GDP against the global average of 9%, India has among the lowest spends on healthcare. To cover over 100 million poor and vulnerable families, the Government has taken a hallmark step of launching a National Health Protection Scheme (NHPS). An annual coverage scheme provides 5 lakhs per family for secondary and tertiary care hospitalization.
According to IQVIA, spending on medicines is projected to grow by 9-12% in the next five years compared to China’s 5-8%. In the ongoing financial year, this growth will thrust India forward to reach the list of the Top 10 countries.
Peer Review
|
Name |
Last Price |
Market Cap. |
Sales Turnover |
Net Profit |
Total Assets |
|
Sun Pharma |
455.05 |
109,181.43 |
7,947.60 |
2,633.79 |
64,302.80 |
|
Aurobindo |
802.35 |
47,010.30 |
10,303.15 |
2,419.78 |
21,105.20 |
|
Dr Reddys Labs |
2,673.80 |
44,397.34 |
9,359.30 |
912.40 |
22,544.30 |
|
Cipla |
536.25 |
43,190.57 |
11,444.81 |
1,419.35 |
22,860.55 |
|
Lupin |
902.00 |
40,794.41 |
10,088.18 |
1,344.66 |
26,305.38 |
|
Piramal Enter |
2,201.85 |
40,373.08 |
3,288.63 |
4,840.19 |
72,683.39 |
Profit and Loss
|
Particulars (Rs. Cr) |
FY18 |
FY17 |
FY16 |
FY15 |
FY14 |
|
INCOME |
|
||||
|
Revenue From Operations [Gross] |
9,853.90 |
12,398.08 |
10,882.87 |
9,705.05 |
8,857.66 |
|
Less: Excise/Sevice Tax/Other Levies |
7.60 |
126.95 |
123.93 |
93.51 |
80.48 |
|
Revenue From Operations [Net] |
9,846.30 |
12,271.13 |
10,758.94 |
9,611.54 |
8,777.18 |
|
Other Operating Revenues |
234.28 |
355.07 |
460.90 |
140.93 |
162.20 |
|
Total Operating Revenues |
10,080.58 |
12,626.20 |
11,219.84 |
9,752.47 |
8,939.38 |
|
Other Income |
131.12 |
88.47 |
186.85 |
180.63 |
415.38 |
|
Total Revenue |
10,211.70 |
12,714.67 |
11,406.69 |
9,933.10 |
9,354.76 |
|
EXPENSES |
|
||||
|
Cost Of Materials Consumed |
2,259.53 |
2,206.82 |
2,337.59 |
2,239.32 |
2,132.00 |
|
Purchase Of Stock-In Trade |
1,130.15 |
1,320.21 |
1,106.73 |
942.50 |
829.19 |
|
Changes In Inventories Of FG,WIP And Stock-In Trade |
84.67 |
-185.26 |
-172.72 |
-170.80 |
-76.21 |
|
Employee Benefit Expenses |
1,441.64 |
1,403.03 |
1,218.09 |
1,052.55 |
844.32 |
|
Finance Costs |
33.24 |
29.42 |
24.11 |
4.90 |
20.99 |
|
Depreciation And Amortisation Expenses |
389.81 |
366.11 |
305.61 |
336.79 |
167.63 |
|
Other Expenses |
3,078.73 |
3,395.28 |
2,743.15 |
2,315.65 |
2,297.75 |
|
Total Expenses |
8,417.77 |
8,535.61 |
7,562.56 |
6,720.91 |
6,215.67 |
|
Profit/Loss Before Exceptional, ExtraOrdinary Items And Tax |
1,793.93 |
4,179.06 |
3,844.13 |
3,212.19 |
3,139.09 |
|
Profit/Loss Before Tax |
1,793.93 |
4,179.06 |
3,844.13 |
3,212.19 |
3,139.09 |
|
Current Tax |
386.57 |
949.34 |
1,027.78 |
849.60 |
811.70 |
|
Deferred Tax |
62.70 |
88.39 |
-14.52 |
-30.67 |
4.76 |
|
Total Tax Expenses |
449.27 |
1,037.73 |
1,013.26 |
814.84 |
814.87 |
|
Profit/Loss After Tax And Before ExtraOrdinary Items |
1,344.66 |
3,141.33 |
2,830.87 |
2,397.35 |
2,324.22 |
|
Profit/Loss From Continuing Operations |
1,344.66 |
3,141.33 |
2,830.87 |
2,397.35 |
2,324.22 |
|
Profit/Loss For The Period |
1,344.66 |
3,141.33 |
2,830.87 |
2,397.35 |
2,324.22 |
|
EARNINGS PER SHARE |
|
||||
|
Basic EPS (Rs.) |
29.76 |
69.63 |
62.92 |
53.00 |
51.88 |
|
Diluted EPS (Rs.) |
29.66 |
69.35 |
62.55 |
53.00 |
51.62 |
Lupin Limited - Balance Sheet
|
Particulars (Rs. Cr) |
FY18 |
FY17 |
FY16 |
FY15 |
FY14 |
|
Equity Share Capital |
90.42 |
90.32 |
90.12 |
89.90 |
89.68 |
|
Total Share Capital |
90.42 |
90.32 |
90.12 |
89.90 |
89.68 |
|
Reserves and Surplus |
15,694.54 |
14,689.92 |
11,822.95 |
8,937.84 |
6,889.36 |
|
Total Reserves and Surplus |
15,694.54 |
14,689.92 |
11,822.95 |
8,937.84 |
6,889.36 |
|
Total Shareholders Funds |
15,784.96 |
14,780.24 |
11,913.07 |
9,027.74 |
6,979.04 |
|
Equity Share Capital |
90.42 |
90.32 |
90.12 |
89.90 |
89.68 |
|
NON-CURRENT LIABILITIES |
|
||||
|
Long Term Borrowings |
4.08 |
8.89 |
13.86 |
19.14 |
24.24 |
|
Deferred Tax Liabilities [Net] |
258.33 |
210.21 |
126.97 |
189.22 |
247.93 |
|
Total Non-Current Liabilities |
559.83 |
502.39 |
367.97 |
319.98 |
358.60 |
|
CURRENT LIABILITIES |
|
||||
|
Short Term Borrowings |
8.21 |
579.62 |
372.96 |
20.95 |
115.16 |
|
Trade Payables |
1,427.87 |
1,478.49 |
1,128.94 |
1,042.04 |
983.85 |
|
Other Current Liabilities |
753.09 |
367.03 |
342.45 |
101.48 |
126.51 |
|
Short Term Provisions |
147.04 |
140.47 |
110.75 |
495.52 |
235.80 |
|
Total Current Liabilities |
2,336.21 |
2,565.61 |
1,955.10 |
1,659.99 |
1,461.32 |
|
Total Capital And Liabilities |
18,681.00 |
17,848.24 |
14,236.14 |
11,007.71 |
8,798.96 |
|
ASSETS |
|
||||
|
NON-CURRENT ASSETS |
|
||||
|
Tangible Assets |
3,027.23 |
2,992.98 |
2,327.84 |
2,020.67 |
2,170.91 |
|
Capital Work-In-Progress |
849.99 |
480.76 |
624.25 |
489.96 |
267.05 |
|
Fixed Assets |
4,511.70 |
3,493.28 |
2,969.18 |
2,525.56 |
2,446.51 |
|
Long Term Loans And Advances |
61.69 |
53.52 |
39.01 |
239.45 |
319.70 |
|
Total Non-Current Assets |
9,963.55 |
8,597.47 |
6,979.66 |
4,555.59 |
3,755.26 |
|
CURRENT ASSETS |
|
||||
|
Inventories |
2,180.02 |
2,125.66 |
1,913.96 |
1,739.51 |
1,372.24 |
|
Trade Receivables |
4,946.31 |
3,902.45 |
4,545.15 |
2,515.21 |
2,859.92 |
|
Cash And Cash Equivalents |
110.96 |
172.84 |
34.96 |
59.30 |
146.28 |
|
Short Term Loans And Advances |
17.63 |
15.00 |
11.99 |
292.50 |
259.44 |
|
OtherCurrentAssets |
1,229.94 |
922.82 |
750.42 |
191.63 |
231.21 |
|
Total Current Assets |
8,717.45 |
9,250.77 |
7,256.48 |
6,452.12 |
5,043.70 |
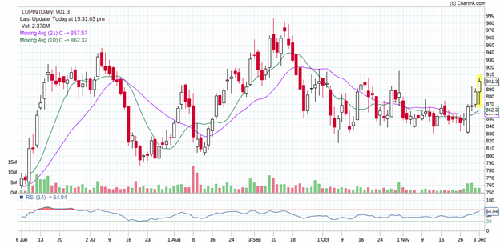
Stock Performance Chart
- Share :


Post a Comment
|
DISCLAIMER |
This report is only for the information of our customers. Recommendations, opinions, or suggestions are given with the understanding that readers acting on this information assume all risks involved. The information provided herein is not to be construed as an offer to buy or sell securities of any kind. ATS and/or its group companies do not as assume any responsibility or liability resulting from the use of such information.