JK CEMENT
|
Industry |
Market Price |
Recommendation |
Target |
Time Horizon |
|
|
Cement Industry |
705.00 |
BUY |
800 |
12 months |
|
JK Cement - Company Profile
J.K. Cement Limited founded in 1975 and is based in Kanpur, manufacture and sale of grey and white cement in India. The grey cement of the company consists of ordinary Portland cement and Portland pozzolana cement, as well as white cement based wall putty for cement plastered walls and ceilings. The company offers its grey cement products under the JK Cement brand name and white cement under the brand names of J.K. White and Camel. The company sells grey cement primarily in northern India and exports white cement to South Africa, Nigeria, Singapore, Bahrain, Bangladesh, Sri Lanka, Kenya, Tanzania, the United Arab Emirates, and Nepal.
JK Cement - Investment Summary
|
CMP (Rs) |
5,447.41 |
|
52 Week H/L |
1193.95/650.00 |
|
Market Cap (Cr) |
5,447.41 |
|
Face Value (Rs) |
10.00 |
|
Promoter Holding (%) |
64.16 |
|
Non-PromoterHolding (%) |
35.84 |
|
Total (%) |
100.00 |
-
One of leading manufacturer of Grey cement in India
-
3rd largest player of white cement in the world cement in India
-
business expansion
-
Reduced its debts
-
Increased production
-
Increased Production
JK Cement - Financial Summary
|
Particulars(Rs. Cr) |
Mar 18 |
Mar 17 |
Mar 16 |
Mar 15 |
Dec 13 |
|
Total Assets |
2,505.71 |
2,480.23 |
2,465.89 |
2,189.70 |
2,116.09 |
|
Total Revenue |
1,618.91 |
1,530.24 |
1,716.33 |
1,431.21 |
1,030.61 |
|
Profit after Tax |
336.18 |
200.90 |
139.34 |
121.32 |
-3.46 |
|
EPS( Rs) |
8.00 |
5.00 |
3.00 |
3.00 |
-1.00 |
Outlook and Valuation
The 2Q results of the company are not so effective. The company reported a standalone net profit of Rs 646.9 million for the Q2 ended Sept 30, 2018 almost 30% increase in its net profit compare to last quarter. Sales turnover for this quarter is less compare to last quarter. But the company has a strong brand name and they have well positioned in north India. The company has reduced its debt and they are expanding their business and also their production increased Considering all the point we recommend “Buy” for this stock for long term.
JK Cement - Management Profile
|
Key Personnel |
Designation and Experience |
Auditors |
|
Yadupati Singhania |
Chairman & Managing Director: Mr. Singhania received an undergraduate degree B.Tech (Year 1977) from Indian Institute of Technology Kanpur. He is a businessperson who has been at the helm of 6 different companies and currently is chairman & managing director at J.K. cement, chairman of key corp, chairman for Dr. Gaur hari singhania institute of management & research and president at Kanpur productivity council. |
|
|
Achintya Karati |
Independent Director: Shri. Achintya Karati, non-executive independent director of JK. Cement. He Served as Senior Advisor to ICICI securities ltd and also with ICICI prudential life insurance company. Mr. Achintya has vast experience in finance and legal affairs, spanning over three decades, diverse expertise across commercial, legal and secretarial matters. |
|
|
Kailash Nath Khandelwal |
Director: Mr. Kailash Nath Khandelwal, He has been acting as director of the company since 2004. Mr. Kailash is a commerce graduate and a chartered accountant having experience of more than 45 years in the field of finance, accounts, taxation etc. He also served as president of Jaykay Enterprises Ltd. Mr. Kailash is on the board of other Indian companies and also acted as trustee and member of various educational and social institutions and organizations. |
|
|
Mr. Raj Kumar Lohia |
Independent Director: Mr. RK Lohia working as an Independent director of company since September 2004. He has over 25 years of experience in the fields of commerce and industry. Mr. Lohia is a leading industrialist, serves as director on the board of a number of other companies. He received several awards, including the excellence award 2005 for contribution in the field of entrepreneurship. He holds a Bachelor of Arts degree in Economics from Kanpur University. |
|
JK Cement - Company overview:
The company is one of the largest cement manufacturers in north India. It is also 3rd largest player of white cement in the world cement in India, which was founded by Lala Kamlapat Singhania. This company has over four decades of experience in cement manufacturing.
The Company is the 2nd largest manufacturer of white cement in India, with an annual capacity of 600,000 tonnes in India and also the second largest producer of Wall putty in the country with an annual installed capacity of 700,000 tonnes. The company was the first company to install a captive power plant in the year 1987 at Bamania, Rajasthan and also the first cement company to take care of the need of green power installed a waste heat recovery power plant. At present, with its different locations, the company has captive power generation capacity of over 140.7 MWs which include 23.2 MW of waste heat recovery power plants.
It offers a range of grey cement, which includes Portland Pozzolana cement, ordinary Portland cement and Portland slag cement. The company’s white cement portfolio includes JK white cement, Jk wall putty, Jk waterproof and Jk primaxx. It white cement is used for decorative and architectural applications. J.K. Wall Putty is white cement based fine powder, which provides a base for concrete/cement plastered walls and ceilings. J.K. Water Proof is a water repellant powder, which prevents passage of water through pores and capillaries of the concrete.
JK Cement - Products
Key Ratios
|
Key Ratios |
FY18 |
FY17 |
FY16 |
FY15 |
FY14 |
|
Debt-Equity Ratio |
1.02 |
1.31 |
1.46 |
1.47 |
1.42 |
|
Current Ratio |
1.34 |
1.18 |
1.29 |
1.22 |
1.32 |
|
Inventory Turnover Ratio (x) |
8.64 |
7.54 |
7.51 |
6.57 |
5.16 |
|
Total Asset Turnover Ratio (%) |
76.75 |
64.27 |
62.69 |
62.61 |
54.79 |
|
PBDIT Margin (%) |
19.34 |
21.10 |
15.98 |
15.38 |
15.12 |
|
PBIT Margin (%) |
15.29 |
16.41 |
11.59 |
11.30 |
10.33 |
|
ROCE (%) |
14.60 |
13.11 |
2.25 |
3.71 |
2.35 |
|
RONW (%) |
15.92 |
11.26 |
5.92 |
9.53 |
6.28 |
|
Price/Book Value (x) |
3.31 |
3.49 |
2.74 |
2.84 |
1.09 |
|
EV/EBITDA (x) |
9.85 |
10.80 |
11.82 |
12.97 |
8.32 |
|
Market Cap/Sales |
1.55 |
1.74 |
1.32 |
1.39 |
0.60 |
JK Cement - Investment Rationale
-
3rd largest player of white cement in the world cement in India
The JK Cement Company is the second largest manufacturer of white cement in India, with an annual capacity of 1.20 MnTPA (Million Metric Tonne Per Annum), also the second largest producer of Wall putty in the country with an annual installed capacity of 700,000 tonnes. This was the first company to install a captive power plant in the year 1987 at Bamania, Rajasthan, also the first cement company to install a waste heat recovery power plant to take care of the need of green power. White Cement production has increased by 2 % at 5.56 Lac Tonne during the year compared to 5.44 Lac Tonne last year while production of value added product wall putty registered increase of 14% at 6.20 Lac Tonne during the year as compared to 5.43 Lac Tonne last year. Additional installed capacity of 0.20 MnTPA of White Cement-based Wall Putty at Katni, Madhya Pradesh to be commissioned in Q1 FY 2018-19.
-
One of leading manufacturer of Grey cement in India
Jk Cement is one of the leading manufacturing of Grey cement in India, with an annual capacity of 1.5MnTPA. During the year production increased by 16.53 % at 7.89 Million Tonne (compared to 6.77 Million Tonne last year) and sales increased by 15.98% at 7.88 Million Tonne (compared to 6.79 Million Tonne last year).
-
business expansion
The company recently launched a qualified institutional placement offering to raise around ₹ 6000 crore from institutional investors for its capital expenditure. The company will be using that amount for business expansion. JKCE has launched a premium product, Super Strong, in South India in October 2018. The same will be launching in other markets in the coming days.
-
Reduced its debts
The company has reduced its total debt levels in the last twelve months, from ₹33b to ₹29b which includes long-term debt. With this reduction in debt, the current cash and short-term investment levels stands at ₹6.1b for investing into the business.
Industry Profile
India is the world's second-largest cement market and has added 110 million tonnes of cement by way of capacity in the last five years. India's cement capacity stood at 460MTPA as of December 2017 and is expected to increase by 5.0-5.5% y-o-y in FY18. India has 575 operational cement plants in the country and this industry is largely dominated by private players (98%). The top 20 cement company’s manufacture around 70% of the total cement and a larger share of bigger plants are situated across southern and western parts of India across the states of Rajasthan, Andhra Pradesh, and Tamil Nadu.
The cement industry is dependent on natural resources and is highly energy intensive. Natural resources like limestone, coal and minerals are essential to produce cement. The industry needs to ensure the continuous supply of these materials at an optimum cost and quality, however due to the depletion of reserves, this is becoming challenging. Volatility in the price of coal is also an area of concern for the industry. The quality of raw material additive and mineral gypsum is also depleting. The MMDRA Act’s new notification as of 12 January 2015 stated that the renewal of mining leases and grants of mining leases and composite licenses will happen through auctions. For continuous operation, there is a need to secure limestone with a minimum reserve of 50 years.
The year was a relatively slow and difficult one for the industry. Cement demand was flat at 1% during the year, affected mainly by demonetization but also because of sand shortage, implementation of the real estate regulatory authority act, weather implications and introduction of GST. A slowdown in the housing sector, which utilizes 65% of India's total cement, also led to the deceleration. Ban on sand mining, use of pet coke and diminished market concentration of industry leaders are some of the other contributing factors. Rural demand was affected by less-than-normal monsoon, while cement demand from industrial capital expenditure was adversely affected due to existence of excess capacities across various industrial sectors.
The ready-mixed concrete industry has been considerably successful globally. RMC in India is still at a nascent stage. RMC accounts for only about 10-12% of the total concrete production in India, which is a small number as compared to western countries, where it comprises 50-70% of the total concrete consumption volume. The penetration level in the metropolitan and tier-I cities is relatively higher and accounts for about 35-40%, while in tier-II cities penetration level is about 20%. Over the past year, there has been a rise in demand for RMC due to technological improvements and innovations. The central government is pushing for more infrastructure development as well as completing ongoing projects in a time-bound plan. The government is also focusing on the creation of “smart cities” which would lead to the construction of commercial, residential, and recreational centers, along with public utilities like roads and railways. This will boost the prospects for RMC as a viable alternative to traditional concrete. RMC is also finding better acceptance among most real estate developers in the country, especially in urban areas. Thus, the potential for this segment remains quite large.
In India, there are 71 companies that operate integrated cement production facilities and 36 companies that operate grinding plants, 6 of which do not have integrated capacity. The top 10 cement producers in India are shown in the below table.
|
Rank |
Company |
Integrated (Mt/yr) |
Grinding (Mt/yr) |
Total (Mt/yr) |
|
1 |
UltraTech Cement |
59.2 |
25.1 |
84.3 |
|
2 |
LafargeHolcim |
41.4 |
23.6 |
65.0 |
|
3 |
Dalmia Bharat |
17.4 |
6.5 |
23.9 |
|
4 |
Shree Cements |
8.0 |
12.2 |
20.2 |
|
5 |
HeidelbergCement |
12.1 |
7.5 |
19.6 |
|
6 |
Ramco Cement |
13.0 |
4.1 |
17.1 |
|
7 |
Chettinad Cement |
14.8 |
2.0 |
16.8 |
|
8 |
The India Cements |
13.0 |
3.7 |
16.7 |
|
9 |
JK Cement |
7.9 |
4.2 |
12.1 |
|
10 |
Vicat |
11.8 |
0.0 |
11.8 |
|
Top 10 Total |
198.6 |
88.9 |
287.5 |
|
|
Indian Total |
328.6 |
117.4 |
446.0 |
|
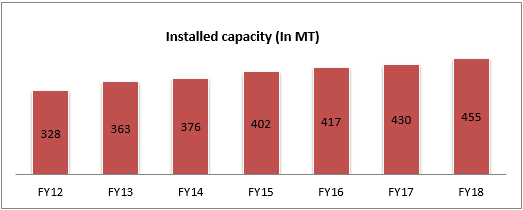
With nearly 455 million tonnes of cement production capacity, India is the second largest cement producer in the world. The cement production capacity by the time of 2020 is estimated to touch 550 MT. all India installed capacity was around 480 MT, in September 2018. Of the total capacity, 98 percent lies with the private sector and the rest with the public sector. The cement demand is expected to grow by 7-8 percent in FY19
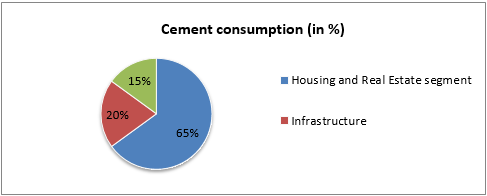
The housing and real estate sector is the biggest demand driver of cement, accounting for about 65% of the total consumption in India. The other major consumers of cement include public infrastructure at 20% and industrial development at 15%.
Peer Review
|
Name |
Last Price |
Market Cap. |
Sales Turnover |
NetProfit |
TotalAssets |
|
UltraTechCement |
3,991.25 |
109,614.00 |
29,790.10 |
2,231.28 |
42,489.21 |
|
Shree Cements |
17,290.95 |
60,236.87 |
9,833.10 |
1,384.18 |
12,290.82 |
|
Ambuja Cements |
223.70 |
44,418.88 |
10,446.85 |
1,249.57 |
19,997.33 |
|
ACC |
1,500.00 |
28,168.09 |
13,284.60 |
915.45 |
9,424.63 |
|
Dalmia Bharat |
2,372.90 |
21,155.19 |
232.53 |
89.69 |
1,475.45 |
|
Ramco Cements |
641.70 |
15,116.96 |
4,406.36 |
555.66 |
5,041.13 |
|
Star Cement |
104.55 |
4,383.04 |
1,463.82 |
210.78 |
1,220.97 |
Profit and Loss
|
Particulars (Rs. Cr) |
Mar 18 |
Mar 17 |
Mar 16 |
Mar 15 |
Mar 14 |
|
INCOME |
|
||||
|
Revenue From Operations [Gross] |
4,709.55 |
4,327.84 |
4,097.80 |
3,859.48 |
3,201.71 |
|
Less: Excise/Sevice Tax/Other Levies |
166.96 |
624.29 |
566.77 |
522.16 |
420.17 |
|
Revenue From Operations [Net] |
4,542.59 |
3,703.55 |
3,531.04 |
3,337.32 |
2,781.54 |
|
Other Operating Revenues |
48.62 |
51.99 |
29.28 |
11.27 |
14.30 |
|
Total Operating Revenues |
4,591.21 |
3,755.54 |
3,560.32 |
3,348.59 |
2,795.85 |
|
Other Income |
127.65 |
99.32 |
49.99 |
59.93 |
47.93 |
|
Total Revenue |
4,718.86 |
3,854.87 |
3,610.32 |
3,408.52 |
2,843.78 |
|
EXPENSES |
|
||||
|
Cost Of Materials Consumed |
730.38 |
644.06 |
665.80 |
556.20 |
462.23 |
|
Purchase Of Stock-In Trade |
0.85 |
0.93 |
1.52 |
1.04 |
0.99 |
|
Changes In Inventories Of FG,WIP And Stock-In Trade |
42.01 |
-9.77 |
8.29 |
-0.95 |
-38.57 |
|
Employee Benefit Expenses |
325.46 |
275.46 |
231.45 |
202.54 |
167.79 |
|
Finance Costs |
245.35 |
272.91 |
269.59 |
219.42 |
152.60 |
|
Depreciation And Amortisation Expenses |
186.27 |
176.10 |
156.28 |
136.60 |
133.97 |
|
Other Expenses |
2,731.86 |
2,151.44 |
1,053.88 |
1,017.66 |
872.14 |
|
Total Expenses |
4,262.17 |
3,511.12 |
3,467.18 |
3,249.37 |
2,707.51 |
|
Profit/LossBeforeExceptional, ExtraOrdinary Items And Tax |
456.69 |
343.75 |
143.13 |
159.15 |
136.27 |
|
Exceptional Items |
-16.96 |
-19.32 |
0.00 |
0.00 |
0.00 |
|
Profit/Loss Before Tax |
439.73 |
324.43 |
143.13 |
159.15 |
136.27 |
|
Current Tax |
94.14 |
70.47 |
30.60 |
33.39 |
28.80 |
|
Deferred Tax |
3.72 |
43.20 |
48.60 |
2.23 |
19.44 |
|
Total Tax Expenses |
97.85 |
113.65 |
41.59 |
2.23 |
39.24 |
|
Profit/Loss After Tax And Before ExtraOrdinary Items |
341.87 |
210.78 |
101.54 |
156.92 |
97.03 |
|
Profit/Loss From Continuing Operations |
341.87 |
210.78 |
101.54 |
156.92 |
97.03 |
|
Profit/Loss For The Period |
341.87 |
210.78 |
101.54 |
156.92 |
97.03 |
|
EARNINGS PER SHARE |
|
||||
|
Basic EPS (Rs.) |
48.89 |
30.14 |
14.52 |
22.44 |
13.88 |
|
Diluted EPS (Rs.) |
48.89 |
30.14 |
14.52 |
22.44 |
13.88 |
JK Cement - Balance Sheet
|
Particulars (Rs. Cr) |
Mar 18 |
Mar 17 |
Mar 16 |
Mar 15 |
Mar 14 |
|
Equity Share Capital |
69.93 |
69.93 |
69.93 |
69.93 |
69.93 |
|
Total Share Capital |
69.93 |
69.93 |
69.93 |
69.93 |
69.93 |
|
Revaluation Reserves |
0.00 |
0.00 |
0.00 |
0.00 |
215.07 |
|
Reserves and Surplus |
1,904.94 |
1,640.76 |
1,517.10 |
1,547.04 |
1,461.15 |
|
Total Reserves and Surplus |
1,904.94 |
1,640.76 |
1,517.10 |
1,547.04 |
1,676.23 |
|
NON-CURRENT LIABILITIES |
|
||||
|
Long Term Borrowings |
2,574.11 |
2,870.15 |
2,871.07 |
2,730.09 |
2,441.52 |
|
|
|
|
|
|
|
|
Deferred Tax Liabilities [Net] |
266.97 |
259.87 |
216.52 |
279.84 |
268.47 |
|
Total Non-Current Liabilities |
3,167.55 |
3,415.44 |
3,304.09 |
3,144.70 |
2,822.00 |
|
CURRENT LIABILITIES |
|
||||
|
Short Term Borrowings |
156.47 |
225.93 |
249.36 |
300.71 |
206.01 |
|
Trade Payables |
435.72 |
427.13 |
304.69 |
307.11 |
440.09 |
|
Other Current Liabilities |
696.76 |
617.19 |
713.15 |
618.57 |
499.69 |
|
Short Term Provisions |
22.82 |
10.51 |
16.80 |
49.30 |
34.91 |
|
Total Current Liabilities |
1,311.77 |
1,280.76 |
1,284.00 |
1,275.68 |
1,180.70 |
|
Total Capital And Liabilities |
6,454.19 |
6,410.87 |
6,184.87 |
6,050.12 |
5,763.35 |
|
ASSETS |
|
||||
|
NON-CURRENT ASSETS |
|
||||
|
Tangible Assets |
4,421.21 |
4,518.39 |
4,233.32 |
4,052.97 |
2,325.80 |
|
Capital Work-In-Progress |
104.27 |
126.75 |
321.09 |
337.14 |
1,787.40 |
|
Fixed Assets |
4,547.61 |
4,668.46 |
4,574.62 |
4,410.93 |
4,114.41 |
|
Long Term Loans And Advances |
1.48 |
1.45 |
435.96 |
396.75 |
268.89 |
|
Total Non-Current Assets |
4,750.38 |
4,931.61 |
4,857.81 |
4,571.79 |
4,407.57 |
|
CURRENT ASSETS |
|
||||
|
Inventories |
589.81 |
560.89 |
493.11 |
541.48 |
541.95 |
|
Trade Receivables |
235.79 |
201.93 |
211.35 |
177.08 |
111.71 |
|
Cash And Cash Equivalents |
559.47 |
435.31 |
373.12 |
417.14 |
408.64 |
|
Short Term Loans And Advances |
0.00 |
0.00 |
0.00 |
302.60 |
232.56 |
|
OtherCurrentAssets |
241.17 |
215.86 |
186.11 |
9.54 |
14.41 |
|
Total Current Assets |
1,703.82 |
1,479.26 |
1,327.06 |
1,478.33 |
1,355.77 |
|
Total Assets |
6,454.19 |
6,410.87 |
6,184.87 |
6,050.12 |
5,763.35 |
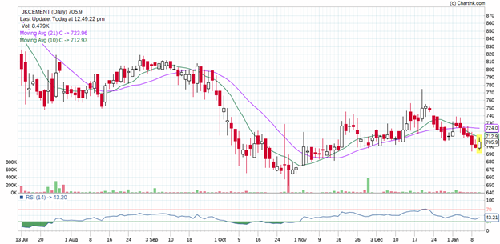
Stock Performance Chart
- Share :


Post a Comment
|
DISCLAIMER |
This report is only for the information of our customers. Recommendations, opinions, or suggestions are given with the understanding that readers acting on this information assume all risks involved. The information provided herein is not to be construed as an offer to buy or sell securities of any kind. ATS and/or its group companies do not as assume any responsibility or liability resulting from the use of such information.