Jamna Auto
Jamna Auto Industries Limited - Background
Jamna Auto Industries Limited is engaged in providing automotive suspension solutions for commercial vehicles. Jamna Auto Industries Ltd is engaged in the business of manufacturing and selling parabolic and tapered leaf springs. The Company's products include Suspension Products, including Rear Air Suspension-Cow Horn Style; Lift Axle-Steerable/Non-Steerable, and Bogie Suspension-Tandem Axle; Multileaf Springs, and Parabolic Springs. The Company's Rear Air Suspension-Cow Horn Style features include upper v-link for lateral positioning, manageable axle thrust, and pinion angle, and is designed to be serviceable using common tools. Its Lift Axle-Steerable/Non Steerable features include an auto load sensing system; lift-over ride in the cab; steer lock system and reverse caster shocks. Its manufacturing plants are located in various areas, including Yamuna Nagar, Haryana; Bhind, Madhya Pradesh; Kharsawan, Jharkhand; Krishnagiri, Tamil Nadu; Pune, Maharashtra, and Sriperumbudur, Tamil Nadu. Source: Reuters
|
BSE Code |
520051 |
|
NSE Code |
JAMNAAUTO |
|
Reuters Code |
JMNA.NS |
|
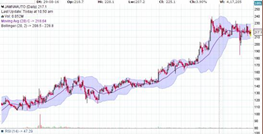
CMP (as on 18/10/2016) |
217.00 |
|
Stock Beta |
1.68 |
|
52 Week H/L |
239.60/113.60 |
|
Market Cap (Cr) |
1724.13 |
|
Equity Capital (Rs cr) |
39.9 |
|
Face Value (Rs) |
5 |
|
Average Volume |
300219 |
|
|
|
|
Shareholding Pattern (%) |
|
|
Promoters |
47.91 |
|
Non Institutions |
52.09 |
|
Grand Total |
100 |
Jamna Auto Industries Limited - Investment Rationale
-
Market leader with strong market share
-
CV segment continue to grow
-
GST to provide more aftermarket opportunities
-
Strong financials and healthy return ratios
-
Product diversification
Jamna Auto Industries Limited - Risks and Concerns
-
Client concentration
-
Cyclical nature of CV industry
-
Fluctuations in price of raw materials
Jamna Auto Industries Limited - Conclusion & Recommendation
Jamna Auto Industries Ltd dominant player in the tapered leaf springs and parabolic springs industry with a presence in different market segments. With the positive forecast of the industry, its emphasis on high margin products, action plan of “ LAKSHYA”, along with strong financial and client base we expect the company to outperform the industry in both medium-term and long term future.
At the current market price of Rs.217 the stock is trading at ~13x FY18E EPS. Investors could buy the stock at CMP and add on dips to around Rs.204 to Rs.199 levels (~12x FY18E EPS) for the sequential targets of Rs.260 and Rs.286 (~15.5 to ~17x FY18E EPS).
Jamna Auto Industries Limited - Financial Summary
|
Particulars (Rs. in Crs) |
FY14 |
FY15 |
FY16 |
FY17E |
FY18E |
|
Net Sales |
816.60 |
1073.50 |
1236.99 |
1428.72 |
1650.18 |
|
Operating Profit |
66.69 |
96.50 |
164.95 |
203.15 |
248.51 |
|
PAT |
13.84 |
29.38 |
71.50 |
102.58 |
133.90 |
|
EPS (Rs.) |
1.73 |
3.68 |
8.96 |
12.86 |
16.78 |
|
PE (x) |
125.12 |
58.94 |
24.22 |
16.88 |
12.93 |
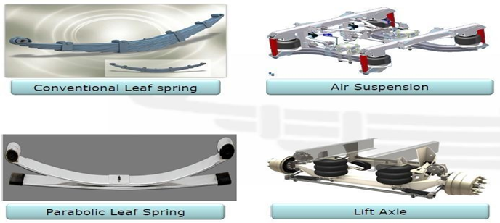
Business Profile
Jamna Auto Industries Limited is India's largest, and amongst the world's third-largest, manufacturers of tapered leaf springs and parabolic springs for automobiles. The Company was the first to introduce parabolic springs in India. Jamna Auto Industries Ltd was promoted by Mr. Bhupinder Singh Jauhar. He started the Tapered Leaf Spring business in 1954 in a small shop in Yamuna Nagar which was converted in company formation in the year 1965. Mr. Jauhar is currently the non-executive Chairman of the board of directors of the company and is the Chief Mentor of the Group. The Company has diversified its range by adding Lift Axle and Air Suspension products under technical collaboration with Ridewell Corporation, USA.
Jamna Auto Industries Ltd has seven strategically located manufacturing facilities at Yamuna Nagar, Malanpur (near Gwalior), Chennai, Jamshedpur, Houser, Pune, and Pantnagar (under subsidiary entity). The Company is the market leader with a 64% market share in the India OEM segment and produces over 410 modes of springs for OEMs. Domestic Market operations are being looked after by our subsidiary entity i.e. Jai Suspension Systems LLP (LLP). The LLP has expanded its presence across 390 towns in the country with a product range of over 4200 part numbers.
Jamna Auto Industries Ltd has an indigenous R&D Centre capable to design Multi, Parabolic Leaf Springs, Lift Axles, and Air Suspension for all automobile applications. The R&D Centre has the facility of in-house validation and testing of products using Servo Actuator to simulate actual vehicle conditions. The Company's engineering & design strength and developmental capabilities make it a partner of choice with most of the customers. The Company's R&D team works closely with customers in design modification and value engineering in Tapered Leaf and Parabolic Springs which enhances the vehicles' load-bearing capacity and overall efficiency.
Investment Rationales
Market leader with strong market share
Jamna Auto Industries Ltd is a market leader in the CV suspension leaf spring segment (90% of sales), including products like the conventional leaf spring and parabolic leaf spring. It currently has a ~67% market share in the conventional leaf springs segment and is a market leader in the parabolic leaf spring segment (~95%). It will ramp up its capacity to 2,20,000 tonnes by FY17-end from 1,80,000 tonnes. Jamna operates in a capacity utilization range of ~80-85%, with the additional capacity Jamna will in able to capitalize on the increase in demand arising from the picking of CV cycle, aftermarket, and exports segment.
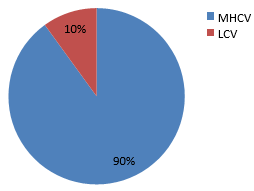
CV segment continue to grow
The Medium & Heavy Commercial Vehicles (M&HCV -Truck) segment in India is likely to register a growth of 12-14% in FY 2016 driven by continuing trend towards replacement of aging fleet and expectations of a pick-up in demand from infrastructure and industrial sectors in view of reforms being initiated by the Government. Over the medium term, the demand for new CVs will also be driven by gradual acceptance of advanced trucking platforms, progression to BS-V emission norms (possibly by 2017 onwards), and introduction of technologies such as Anti-Lock Braking System (ABS), which may lead to some advance purchases by fleet operators. M&HCV segment grew by 28.2% to reach 337565 in FY16 compared to 17.45 in the previous year. In the LCV segment, we expect that the demand is likely to pick up in FY 2017 on the back of expectation of replacement-led demand (i.e. three years of declining sales), some pre-buying ahead of the implementation of BS-IV norms (by April 2017), and gradual improvement in viability on back of lower diesel prices (SCV freight rates remain relatively sticky) and pick-up in consumption-driven sectors. In contrast to a decline of 2-4% in FY 20167, the segment is likely to witness a growth of ~10% in FY 2017e. With the government driving initiatives like ‘Make in India’, which are aimed at boosting the manufacturing sector among others, the need for better logistical support is becoming all the more essential which provides Jamna the opportunity to capitalize on the CV demand and convert it into revenue growth.
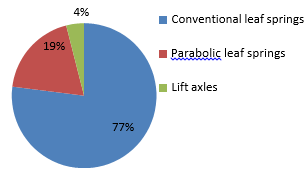
Segment-wise revenue breakup
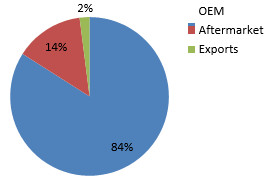
GST to provide more aftermarket opportunities
The auto component industry is estimated to become the third-largest in the world by the end of 2016, accounting for more than 5% of global vehicle sales, while the industry is expected to become the fourth largest automobiles producer globally by 2020 after China, US, and Japan. The organized sector caters to the original equipment manufacturers (OEMs) and consists of high-value precision instruments, while the unorganized sector comprises low-valued products and caters mostly to the aftermarket category. With the implementation of GST Auto ancillary industry’s effective tax rate which is currently at 28-30% is expected to come down to 18% upon implementation of GST. However, this benefit will be passed on to OEMs, which will eventually drive expansion in auto demand. The aftermarket for suspension segment has a market size of about Rs 1,600-1,800 crore it is expected to improve the price competitiveness of the organized players, especially in products largely sold in the aftermarket segment. The OEM market is very competitive and component manufacturers have to compromise on margins to bag bulk orders and margins in the replacement market are higher than the OEM market. Jamna being a dominant player in this segment is expected to be a major beneficiary in the aftermarket segment and add revenue contribution from the aftermarket segment from the current level of ~15%.
Export opportunities
Jamna has set up a new plant in Hosur to serve the export markets and multinational companies such as Daimler and Volvo. Jamna Auto is prioritizing its focus towards exports as it aims to get 10 percent of the total revenue from exports, which currently stands at 2 percent.
Strong financials and healthy return ratios
The debt of Jamna stands at Rs.9.86 crore and has a debt/equity ratio of 0.18. Also, Jamna Auto Industries Ltd is following better working capital management by adopting a just-in-time approach (leading to lower inventory) and having better negotiation terms with customers. Given the robust top-line growth coupled with an improved working capital cycle, Jamna&rsquo's capital expenditure is likely to be met through internal accruals. It has a ROCE of 40.05% and an EBITDA margin of 12.1%, and the return ratios and margins are expected to remain on the current levels mainly due to companies initiative to achieve 33% of revenue from new products and new markets, increase in the share of value-added products in total revenue and subdued commodity prices which contributes ~72% of overall expenditure.
Strong client base
The clients of Jamna includes domestic and international majors such as AMW, Ashok Leyland, Nissan, Bharat Benz, Daimler, Isuzu, Kamaz, Mahindra, Man, Renault, SML Izuzu, Tata, UD Trucks, VE, Volvo, etc. Being the preferred supplier of OEM to the major players in the industry with the expected increase in demand for the HCV, CV and LCV vehicles Jamna is expected to benefit the most.

Product diversification
Jamna under the “Lakshya” initiative, 33% revenue contribution from new products. It is focusing on new products such as parabolic leaf springs, lift axles, and air suspension systems. JAI has been a pioneer in introducing parabolic springs (currently holds 95% market share) which are stronger as compared to conventional springs and offer more driving comfort. The penetration of parabolic springs currently stands at 18% and is expected to reach 25% levels over the next three years. JAI aims to be a leader in automobile suspension solutions. It aims to be a full suspension system provider and has expanded its product profile. In 2013, JAI ventured into manufacturing lift axles and air suspensions with a technological collaboration with Ridewell Corporation, USA.
Industry Overview
The Indian auto-components industry has experienced healthy growth over the last few years. Some of the factors attributable to this include: a buoyant end-user market, improved consumer sentiment, and return of adequate liquidity in the financial system. The auto-components industry accounts for almost seven percent of India&rsquo's Gross Domestic Product (GDP) and employs as many as 19 million people, both directly and indirectly. A stable government framework increased purchasing power, large domestic market, and an ever-increasing development in infrastructure have made India a favorable destination for investment.
The Indian auto-components industry can be broadly classified into organized and unorganized sectors. The organized sector caters to the Original Equipment Manufacturers (OEMs) and consists of high-value precision instruments while the unorganized sector comprises low-valued products and caters mostly to the aftermarket category. Over the last decade, the automotive components industry has scaled three times to US$ 40 billion in 2015 while exports have grown even faster to US$ 11 billion. This has been driven by strong growth in the domestic market and increasing globalization (including exports) of several Indian suppliers.
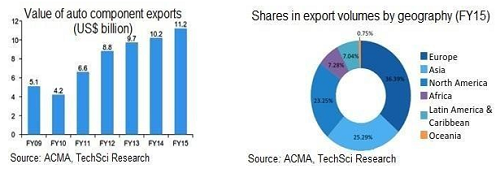
The Indian Auto Component industry is expected to grow by 8-10 percent in FY 2017-18, based on higher localization by Original Equipment Manufacturers (OEM), higher component content per vehicle, and rising exports from India, as per ICRA Limited. According to the Automotive Component Manufacturers Association of India (ACMA), the Indian auto-components industry is expected to register a turnover of US$ 100 billion by 2020 backed by strong exports ranging between US$ 80- US$ 100 billion by 2026, from the current US$ 11.2 billion.
The Government of India&rsquo's Automotive Mission Plan (AMP) 2006–2016 has come a long way in ensuring growth for the sector. It is expected that this sector's contribution to the GDP will reach US$ 145 billion in 2016 due to the government’s special focus on exports of small cars, multi-utility vehicles (MUVs), two and three-wheelers, and auto components. Separately, the deregulation of FDI in this sector has also helped foreign companies to make large investments in India. The Government of India&rsquo's Automotive Mission Plan (AMP) 2016–2026 envisages the creation of an additional 50 million jobs along with an ambitious target of increasing the value of the output of the sector to up to Rs 18,89,000 crore (US$ 282.65 billion).
The rapidly globalizing world is opening up newer avenues for the transportation industry, especially while it makes a shift towards electric, electronic and hybrid cars, which are deemed more efficient, safe, and reliable modes of transportation. Over the next decade, this will lead to newer verticals and opportunities for auto-component manufacturers, who would need to adapt to the change via systematic research and development. The Indian auto-components industry is set to become the third-largest in the world by 2025. Indian auto-component makers are well positioned to benefit from the globalisation of the sector as exports potential could be increased by up to four times to US$ 40 billion by 2020.
Jamna Auto Industries Limited - Risks and Concerns
Client concentration
We believe that high client concentration is a key risk for the company. Tata Motors and Ashok Leyland together account for almost 65% of the company’s revenues. A decrease in sales of these major clients can make a significant impact on companies overall revenue.
Cyclical nature of CV industry
The cyclical nature of the CV industry has led to significant volatility in JAI’s margins and earnings trajectory on a historical basis. A slowdown in demand for CV vehicles can adversely affect the revenue trajectory of Jamna.
Fluctuations in the price of raw materials
An increase in key raw materials can make a significant difference in the margins of Jamna as it contributes ~72% of the overall expenses.
Jamna Auto Industries Limited - Financials
Q1 FY17
|
|
1st Qtr201606 |
1st Qtr201506 |
VAR[%] |
4th Qtr201603 |
4th Qtr201503 |
VAR[%] |
|
Gross Sales |
330.6 |
285.02 |
16 |
362.03 |
335.87 |
-7.8 |
|
Excise Duty |
0 |
0 |
0 |
0 |
0 |
0 |
|
Net Sales |
330.6 |
285.02 |
16 |
362.03 |
335.87 |
-7.8 |
|
Other Operating Income |
4.54 |
5.05 |
-10.1 |
4.33 |
6.24 |
30.6 |
|
Other Income |
5.49 |
1.93 |
184.5 |
1.77 |
0.91 |
-94.5 |
|
Total Income |
340.62 |
292.01 |
16.6 |
368.12 |
343.02 |
-7.3 |
|
Total Expenditure |
282.33 |
261.82 |
7.8 |
309.62 |
303.18 |
-2.1 |
|
PBIDT |
58.29 |
30.19 |
93.1 |
58.51 |
39.84 |
-46.9 |
|
Interest |
1.49 |
3.14 |
-52.5 |
4.07 |
4.42 |
7.9 |
|
PBDT |
56.8 |
27.05 |
110 |
54.44 |
35.42 |
-53.7 |
|
Depreciation |
17.36 |
8.31 |
108.9 |
12.44 |
10.54 |
-18.0 |
|
Minority Interest Before NP |
0 |
0 |
0 |
0 |
0 |
0 |
|
PBT |
39.44 |
18.74 |
110.5 |
42 |
24.88 |
-68.8 |
|
Tax |
12.03 |
5.92 |
103.2 |
14.11 |
9.57 |
-47.4 |
|
Reported Profit After Tax |
27.41 |
12.82 |
113.8 |
27.89 |
15.31 |
-82.2 |
|
Minority Interest After NP |
0 |
0 |
0 |
0 |
0 |
0 |
|
NP after Minority Int & P/L Asso.Co. |
27.41 |
12.82 |
113.8 |
27.89 |
15.31 |
-82.2 |
|
Extra-ordinary Items |
0 |
0 |
0 |
0 |
0 |
0 |
|
Adjusted Profit After Extra-ordinary item |
27.41 |
12.82 |
113.8 |
27.89 |
15.31 |
-82.2 |
|
|
|
|
|
|
|
|
|
PBIDTM(%) |
17.63 |
10.59 |
66.5 |
16.16 |
11.86 |
-36.26 |
|
PBDTM(%) |
17.18 |
9.49 |
81 |
15.04 |
10.55 |
-42.56 |
|
PATM(%) |
8.29 |
4.5 |
84.2 |
7.7 |
4.56 |
-68.86 |
Profit and Loss Account (consolidated as per rough estimates)
|
|
FY14 |
FY15 |
FY16 |
FY17E |
FY18E |
|
Gross Sales |
816.6 |
1073.5 |
1236.99 |
1428.72 |
1650.18 |
|
Excise Duty |
0 |
0 |
0 |
0 |
0 |
|
Net Sales |
816.6 |
1073.5 |
1236.99 |
1428.72 |
1650.18 |
|
Other Operating Income |
16.7 |
21.58 |
18.8 |
21.13 |
22.18 |
|
Other Income |
19.58 |
2.01 |
8.35 |
10.58 |
11.82 |
|
Total Income |
852.88 |
1097.08 |
1264.14 |
1460.42 |
1684.17 |
|
Total Expenditure |
786.19 |
1000.58 |
1099.2 |
1257.28 |
1435.65 |
|
PBIDT |
66.69 |
96.5 |
164.95 |
203.15 |
248.51 |
|
Interest |
24.07 |
18.02 |
14.73 |
15.41 |
13.72 |
|
PBDT |
42.62 |
78.48 |
150.22 |
187.74 |
234.80 |
|
Depreciation |
25.91 |
31.1 |
45.23 |
42.23 |
44.87 |
|
Minority Interest Before NP |
0 |
0 |
0 |
0 |
0 |
|
PBT |
16.71 |
47.38 |
104.99 |
145.51 |
189.93 |
|
Tax |
2.87 |
18 |
33.48 |
42.93 |
56.03 |
|
Fringe Benefit Tax |
0 |
0 |
0 |
0 |
0 |
|
Deferred Tax |
0 |
0 |
0 |
0 |
0 |
|
Reported Profit After Tax |
13.84 |
29.38 |
71.5 |
102.58 |
133.90 |
|
Minority Interest After NP |
0 |
0 |
0 |
0 |
0 |
|
Profit/Loss of Associate Company |
0 |
0 |
0 |
0 |
0 |
|
NP after Minority Int & P/L Asso.Co. |
13.84 |
29.38 |
71.5 |
102.58 |
133.90 |
|
|
|
|
|
|
|
|
PBIDTM(%) |
8.17 |
8.99 |
13.33 |
14.22 |
15.06 |
|
PBDTM(%) |
5.22 |
7.31 |
12.14 |
13.14 |
14.23 |
|
PATM(%) |
1.69 |
2.74 |
5.78 |
7.18 |
8.11 |
Balance Sheet (consolidated as per rough estimates)
|
|
FY14 |
FY15 |
FY16 |
FY17E |
FY18E |
|
SOURCES OF FUNDS: |
|
|
|
|
|
|
Share Capital |
41.25 |
39.62 |
39.72 |
39.8 |
39.9 |
|
Reserves & Surplus |
140.35 |
156.8 |
202.46 |
265.0 |
346.7 |
|
Equity Application Money |
0 |
0 |
0.36 |
0 |
0 |
|
Loan Funds |
88.48 |
26.33 |
9.82 |
9.6 |
8.6 |
|
Deferred Tax Liability |
14.8 |
15.91 |
5.68 |
9.3 |
8.1 |
|
Other Liabilities |
4.25 |
5.33 |
6.28 |
7.2 |
8.2 |
|
Total Liabilities |
289.14 |
243.99 |
264.33 |
330.9 |
411.6 |
|
APPLICATION OF FUNDS: |
|
|
|
|
|
|
Fixed Assets |
261.58 |
249.72 |
276.14 |
260.3 |
267.5 |
|
Current Assets, Loans & Advances |
244.86 |
204.89 |
167.14 |
234.2 |
330.6 |
|
Inventories |
100.74 |
109.12 |
107.45 |
137.8 |
202.1 |
|
Sundry Debtors |
108.36 |
56.37 |
37.61 |
58.4 |
67.4 |
|
Cash & Bank Balance |
13.71 |
10.73 |
8.02 |
16.1 |
35.9 |
|
Other Current Assets |
8.15 |
8.23 |
0.03 |
0.0 |
0.0 |
|
Loans & Advances |
13.91 |
20.44 |
14.03 |
21.9 |
25.3 |
|
Current Liabilities & Provisions |
249.9 |
250.62 |
220 |
201.5 |
224.0 |
|
Current Liabilities |
243.55 |
239.16 |
176.14 |
175.3 |
193.7 |
|
Provisions |
6.35 |
11.47 |
43.86 |
26.3 |
30.3 |
|
Net Current Assets |
-5.03 |
-45.73 |
-52.86 |
32.7 |
106.6 |
|
Deferred Tax Assets |
0 |
0.07 |
0.31 |
0.6 |
0.8 |
|
Other Assets |
32.6 |
39.93 |
40.74 |
37.9 |
37.4 |
|
Total Assets |
289.14 |
243.99 |
264.33 |
330.9 |
411.6 |
Financial ratios
|
|
FY12 |
FY13 |
FY14 |
FY15 |
FY16 |
|
Debt-Equity Ratio |
1.1 |
1.06 |
0.82 |
0.5 |
0.18 |
|
Current Ratio |
0.8 |
0.73 |
0.76 |
0.81 |
0.75 |
|
Total Asset Turnover Ratio |
3.85 |
3.08 |
2.73 |
4.11 |
5.14 |
|
Interest Cover Ratio |
3.72 |
2.2 |
1.03 |
3.63 |
8.13 |
|
PBIDTM (%) |
8.49 |
8.32 |
5.68 |
8.14 |
12.1 |
|
PBITM (%) |
5.82 |
5.58 |
2.78 |
5.52 |
8.78 |
|
PBDTM (%) |
6.92 |
5.79 |
2.99 |
6.62 |
11.02 |
|
CPM (%) |
6.17 |
5.37 |
3.07 |
5.1 |
8.56 |
|
APATM (%) |
3.5 |
2.63 |
0.17 |
2.48 |
5.24 |
|
ROCE (%) |
16.8 |
13.66 |
6.15 |
18.54 |
40.05 |
|
RONW (%) |
15.39 |
10.9 |
0.47 |
11.6 |
28.25 |
|
Payout (%) |
39.48 |
30.58 |
30.91 |
31.74 |
32.59 |
|
NP / PBT (X) |
0.74 |
0.85 |
1.49 |
0.62 |
0.68 |
|
PBT / EBIT (X) |
0.73 |
0.55 |
0.03 |
0.72 |
0.88 |
|
EBIT / Sales (X) |
0.06 |
0.06 |
0.03 |
0.06 |
0.1 |
|
Sales / Assets (X) |
3.58 |
2.86 |
2.54 |
3.79 |
4.73 |
|
Assets / Equity (X) |
1.27 |
1.37 |
1.3 |
1.14 |
1.05 |
|
Price to Book Value ( P/BV) |
2.71 |
1.82 |
1.56 |
4.9 |
4.56 |
|
Price/Cash EPS (P/CEPS) |
6.17 |
5.68 |
7.27 |
16.42 |
9.83 |
|
EV/EBIDTA |
5.69 |
5.27 |
5.89 |
10.52 |
6.74 |
|
Market Cap/Sales |
0.34 |
0.3 |
0.31 |
0.81 |
0.81 |
Conclusion and Recommendation
We are positive on Jamna over the long term and hence recommend a BUY at CMP of RS.217.00 and further add on declines between Rs.204 to Rs.199 for a target of Rs.260 to Rs.286 with stop loss maintained at Rs.190.
- Share :


Post a Comment
|
DISCLAIMER |
This report is only for the information of our customers. Recommendations, opinions, or suggestions are given with the understanding that readers acting on this information assume all risks involved. The information provided herein is not to be construed as an offer to buy or sell securities of any kind. ATS and/or its group companies do not as assume any responsibility or liability resulting from the use of such information.