Grauer weil India Ltd.
|
Current price |
14.90 |
|
Sector |
Chemicals |
|
No of shares |
226705750 |
|
52 week high |
19.80 |
|
52 week low |
5.39 |
|
BSE Sensex |
28261.08 |
|
Nifty |
8570.90 |
|
Average Volume |
217,212 |
|
BSE Code |
505710 |
Grauer weil India Ltd - Company Overview
Grauer & Weil (India) Limited (GWIL), initially set up as a partnership concern in May 1940 by British nationals Mr Grauer and Mr Weil, was taken over by the More family during 1991 subsequent to a series of change in the promoters. In the initial days of our business, we used to manufacture and supply a wide range of polishing compounds, mops, fibre, wheels, et Grauer weil India Ltd (GWIL) operates in four broad segments: Chemicals, Engineering, Paints and Shopping Mall.
The chemical division manufactures and sells chemicals required for metal finishing (electroplating chemicals), their intermediates and other specialty chemicals and contributes around 66% of the total revenue of Grauer weil India Ltd (GWIL). Growel established various new technical tie-up and JV alliances with world famous names in plating industry. Since then, we were established ourselves as undisputed leader in the field of electroplating in the Indian Surface Finishing Industry.
The engineering division is involved in manufacturing and providing turnkey solution for electroplating plants, effluent treatment plants and other engineering products. Grauer weil India Ltd manufactures and supplies electroplating and allied chemicals and engineering plants to the surface coating industries. The company’s engineering products include electroplating for tanks, barrels, transport wagons, automation, agitation, drying, test equipment, rectifiers, jigs and fixures, titanium anode baskets, oil separator, sludge settler, scrubber; filteration systems such as filters and seals, phosphating, dacrotizing, effluent treatment, industrial degreasing, spare parts, and dedicated plating systems including hard chrome plating of gun barrels, rim plating, countinous plating, and return type.
Growel further expanded its business activities and entered into newer and synergetic areas of business's like manufacturing Industrial Lubes & Protective coatings and, so also diversified into real estate development. Grauer is headquartered in Mumbai, Maharashtra, India. The current market capitalisation stands at Rs337.79 crore
Grauer weil India Ltd - Share Holding Pattern
|
Category |
No. of Shares |
Percentage |
|
Promoters |
155,700,759 |
68.68 |
|
General Public |
54,434,571 |
24.01 |
|
Other Companies |
10,829,449 |
4.78 |
|
Directors |
1,998,240 |
0.88 |
|
Foreign - NRI |
1,637,003 |
0.72 |
|
Others |
1,275,608 |
0.56 |
|
Foreign - OCB |
787,500 |
0.35 |
|
Financial Institutions |
22,000 |
0.01 |
|
NBFC and Mutual Funds |
20,620 |
0.01 |
Grauer weil India Ltd - Financial Details
-
Market Cap (Rs Cr) – 336.66
-
Company P/E (x) – 10.38
-
Industry P/E (x) – 53.84
-
Book Value (Rs) – 8.65
-
Price / BV (x) – 1.76
-
Dividend (%) – 16%
-
EPS (TTM) – 1.43
-
Dividend Yield (%) – 1.08%
-
Face Value (Rs) - 1
Balance Sheet
|
|
Mar '14 |
Mar '13 |
Mar '12 |
Mar '11 |
Mar '10 |
|
Sources Of Funds |
|
|
|
|
|
|
Total Share Capital |
22.67 |
22.67 |
22.67 |
22.67 |
22.67 |
|
Equity Share Capital |
22.67 |
22.67 |
22.67 |
22.67 |
22.67 |
|
Reserves |
173.33 |
147.29 |
131.16 |
112.41 |
100.62 |
|
Networth |
196.00 |
169.96 |
153.83 |
135.08 |
123.29 |
|
Secured Loans |
71.02 |
91.49 |
107.35 |
140.97 |
121.53 |
|
Unsecured Loans |
6.12 |
7.67 |
7.26 |
4.68 |
3.21 |
|
Total Debt |
77.14 |
99.16 |
114.61 |
145.65 |
124.74 |
|
Total Liabilities |
273.14 |
269.12 |
268.44 |
280.73 |
248.03 |
|
Application Of Funds |
|
|
|
|
|
|
Gross Block |
294.02 |
288.88 |
269.26 |
264.46 |
135.60 |
|
Less: Accum. Depreciation |
68.82 |
58.08 |
47.90 |
38.33 |
30.82 |
|
Net Block |
225.20 |
230.80 |
221.36 |
226.13 |
104.78 |
|
Capital Work in Progress |
1.22 |
0.16 |
2.86 |
2.53 |
96.21 |
|
Investments |
4.70 |
4.75 |
3.91 |
1.64 |
1.64 |
|
Inventories |
61.39 |
61.99 |
49.80 |
49.05 |
34.74 |
|
Sundry Debtors |
94.72 |
79.74 |
75.62 |
61.06 |
44.68 |
|
Cash and Bank Balance |
6.21 |
5.66 |
3.79 |
7.89 |
5.58 |
|
Total Current Assets |
162.32 |
147.39 |
129.21 |
118.00 |
85.00 |
|
Loans and Advances |
32.24 |
30.73 |
31.23 |
30.03 |
21.90 |
|
Fixed Deposits |
0.00 |
0.00 |
0.00 |
1.19 |
1.35 |
|
Total CA, Loans & Advances |
194.56 |
178.12 |
160.44 |
149.22 |
108.25 |
|
Current Liabilities |
135.19 |
131.52 |
104.95 |
89.97 |
54.88 |
|
Provisions |
17.34 |
13.18 |
15.18 |
8.83 |
7.98 |
|
Total CL & Provisions |
152.53 |
144.70 |
120.13 |
98.80 |
62.86 |
|
Net Current Assets |
42.03 |
33.42 |
40.31 |
50.42 |
45.39 |
|
Total Assets |
273.15 |
269.13 |
268.44 |
280.72 |
248.02 |
|
Contingent Liabilities |
15.49 |
15.61 |
19.20 |
1.00 |
1.87 |
|
Book Value (Rs) |
8.65 |
7.50 |
6.79 |
59.59 |
54.38 |
Profit and Loss Account
|
|
Mar '14 |
Mar '13 |
Mar '12 |
Mar '11 |
Mar '10 |
|
Income |
|
|
|
|
|
|
Sales Turnover |
385.86 |
335.01 |
333.23 |
332.57 |
262.51 |
|
Excise Duty |
0.00 |
0.00 |
0.00 |
23.87 |
15.21 |
|
Net Sales |
385.86 |
335.01 |
333.23 |
308.70 |
247.30 |
|
Other Income |
3.42 |
2.11 |
2.85 |
3.12 |
0.59 |
|
Stock Adjustments |
-5.86 |
12.13 |
4.79 |
4.28 |
1.63 |
|
Total Income |
383.42 |
349.25 |
340.87 |
316.10 |
249.52 |
|
Expenditure |
|
|
|
|
|
|
Raw Materials |
218.88 |
206.31 |
198.90 |
174.24 |
136.45 |
|
Power & Fuel Cost |
4.19 |
3.69 |
3.29 |
3.31 |
2.16 |
|
Employee Cost |
42.80 |
38.17 |
30.14 |
25.18 |
20.69 |
|
Other Manufacturing Expenses |
0.00 |
0.00 |
0.00 |
6.02 |
3.71 |
|
Selling and Admin Expenses |
0.00 |
0.00 |
0.00 |
53.99 |
41.52 |
|
Miscellaneous Expenses |
53.47 |
45.70 |
47.22 |
9.97 |
7.73 |
|
Total Expenses |
319.34 |
293.87 |
279.55 |
272.71 |
212.26 |
|
Operating Profit |
60.66 |
53.27 |
58.47 |
40.27 |
36.67 |
|
PBDIT |
64.08 |
55.38 |
61.32 |
43.39 |
37.26 |
|
Interest |
16.74 |
20.54 |
21.19 |
15.82 |
9.91 |
|
PBDT |
47.34 |
34.84 |
40.13 |
27.57 |
27.35 |
|
Depreciation |
11.49 |
10.99 |
9.88 |
7.26 |
4.39 |
|
Profit Before Tax |
35.85 |
23.85 |
30.25 |
20.31 |
22.96 |
|
PBT (Post Extra-ord Items) |
35.85 |
23.85 |
30.25 |
20.31 |
22.96 |
|
Tax |
5.06 |
4.03 |
7.03 |
5.89 |
6.54 |
|
Reported Net Profit |
30.79 |
19.83 |
23.21 |
14.41 |
16.42 |
|
Total Value Addition |
100.45 |
87.55 |
80.65 |
98.48 |
75.80 |
|
Equity Dividend |
3.63 |
2.72 |
3.40 |
1.81 |
1.81 |
|
Corporate Dividend Tax |
0.62 |
0.46 |
0.55 |
0.29 |
0.30 |
|
Per share data (annualised) |
|
|
|
|
|
|
Shares in issue (lakhs) |
2,267.06 |
2,267.06 |
2,267.06 |
226.71 |
226.71 |
|
Earning Per Share (Rs) |
1.36 |
0.87 |
1.02 |
6.36 |
7.24 |
|
Equity Dividend (%) |
16.00 |
12.00 |
15.00 |
8.00 |
8.00 |
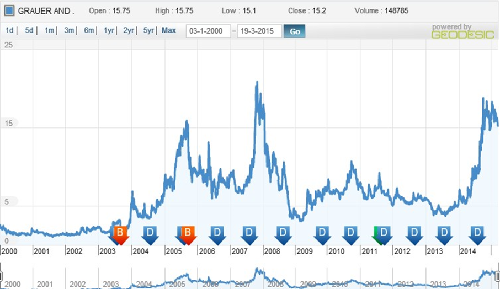
Dividend and Bonus History
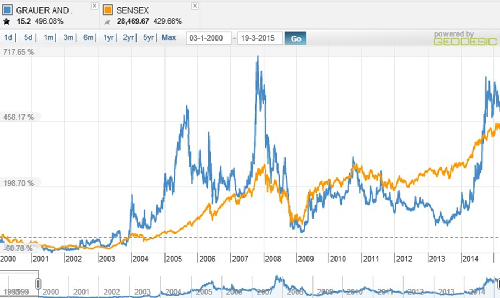
Index and Company Price Movement Comparison
Technical Indicators
|
Symbol |
Value |
Action |
|
RSI(14) |
47.317 |
Neutral |
|
STOCH(9,6) |
61.448 |
Buy |
|
STOCHRSI(14) |
69.368 |
Buy |
|
MACD(12,26) |
-10.540 |
Sell |
|
ADX(14) |
32.122 |
Sell |
|
Williams %R |
-44.399 |
Buy |
|
CCI(14) |
52.1914 |
Buy |
|
ATR(14) |
20.9821 |
High Volatility |
|
Highs/Lows(14) |
0.0000 |
Neutral |
|
Ultimate Oscillator |
50.448 |
Neutral |
|
ROC |
22.598 |
Buy |
|
Bull/Bear Power(13) |
8.7840 |
Buy |
Important Ratios (YoY)
-
PBIT – 12.63 v/s 12.54
-
RoCE – 19.25 v/s 16.49
-
RoE – 11.96 v/s 16.49
-
Net Profit Margin – 7.91 v/s 5.88
-
Return on net worth – 15.71 v/s 11.66
-
D/E Ratio – 0.39 v/s 0.58
-
Interest Cover – 3.14 v/s 2.16
-
Current Ratio – 0.85 v/s 0.79
-
Reserves – 173.33 cr v/s 147.29 cr
-
PAT – 30.79 cr v/s 19.83 cr
-
Total assets – 273.15 cr v/s 269.13 cr
-
Net sales – 385.86 cr v/s 335.01 cr
-
Book Value – 8.65 v/s 7.50
Simple Moving Average
|
Days |
BSE |
|
30 |
16.24 |
|
50 |
16.66 |
|
150 |
15.59 |
|
200 |
13.96 |
Grauer weil India Ltd - Investment Rationalize
-
Grauer Weil India Ltd. is the market leader of electroplating chemicals manufacturing in the country and a prominent player of turnkey solutions for electroplating plants and effluent treatment plants
-
Grauer weil India Ltd has able to generate consistent revenue even in the adverse market conditions along with a cash reserve of Rs.173.33 crore.
-
To manufacture electro-chemicals the company had entered a technical collaboration with Union Inks and Graphics Pte Singapore. It had entered into the collaboration with M/s Enthone-OMI Inc. U.S.A. and M/s Aucos of Germany and M/s Kabushiki Kaisha Nippon Dacro Shamrock, Japan. A joint venture agreement has been entered into with M/s Goema GmbH of Germany to manufacture Effluent Treatment Plants and Metal Recovery Systems, and has entered into Technical Collaboration with Manz GmbH of Germany and Surfilco Inc of USA for assistance in design, manufacture and marketing of Plating Plants, Filters, Pumps and other products.
-
Grauer weil India Ltd is able to reduce debt considerably in the last few years and increase its GPM to 12.3% along with improving financial ratios.
-
Improvement in economic cycle and manufacturing cycle will help the company to use its manufacturing facilities to maximum and will add on to the sales of the company.
-
Revenue from its Paints, Lubricants and Anodizing facilities and companies fully owned subsidiaries will add to the profits of the company.
-
Most of the companies products have very less domestic competition and Price to Sales Ratio stands at very attractive 0.88%.
- Share :


Post a Comment
|
DISCLAIMER |
This report is only for the information of our customers. Recommendations, opinions, or suggestions are given with the understanding that readers acting on this information assume all risks involved. The information provided herein is not to be construed as an offer to buy or sell securities of any kind. ATS and/or its group companies do not as assume any responsibility or liability resulting from the use of such information.