Gabriel India Limited Research Report
|
Market Price |
Recommendation |
Target |
Time Horizon |
|
152.50 |
Buy |
218 |
1-Year |
Q3FY2023 REVIEW
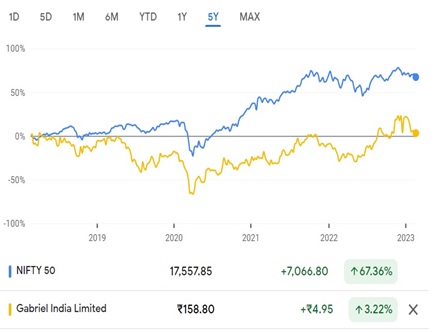
Gabriel India Limited reported net revenue of ₹710.99 crores for the quarter ended December 31, 2022, compared to ₹606.14 crores for December 30, 2021. Profit After Tax was ₹29.12 crores for the quarter ended December 31, 2022, compared to ₹25.69 crores during the corresponding quarter of the previous year, respectively.
STOCK DATA
|
52 Week H/L |
102/200.90 |
|
Market Cap (crores) |
2,190 |
|
Face Value (₹) |
1.00 |
|
Book Value |
53.38 |
|
EPS TTM |
6.23 |
|
NSE Code |
GABRIEL |
Gabriel India Limited - OVERVIEW
-
Gabriel India Ltd is the first indigenous company to create a damper for the Vande Bharat Coach and the Rajdhani/ Shatabdi Coach (LHB).
-
In its sites in Dewas, Khandsa, Hosur, Parwanoo, Sanand, Nashik, and Pune, GIL produces ride-control equipment.
-
With a presence in more than 25 countries and 664 distributors, the firm produces more than 500 models of ride control equipment.
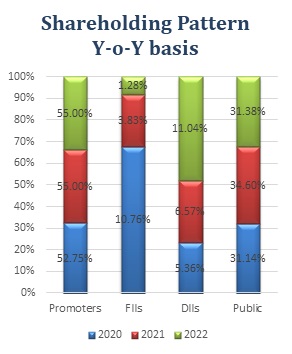
SHAREHOLDING PATTERN (%)
|
|
June-22 |
Sep-22 |
Dec-22 |
|
Promoter |
55.00 |
55.00 |
55.00 |
|
Public |
34.36 |
31.38 |
31.20 |
|
FII |
1.38 |
2.57 |
2.55 |
|
DII |
9.26 |
11.04 |
11.24 |
Gabriel India Limited - BENCHMARK COMPARISON
Beta: 0.66 |
Alpha: -5.10 |
Risk Reward Ratio: 1.24 |
Margin of Safety: 28% |
BUSINESS
-
Being the main business of the ANAND Group and a well-known brand name in the production of ride control equipment, Gabriel India Ltd was established in 1961.
-
The Business evolved from a single-product firm to the most trusted brand in the ride control goods market. For almost six decades in India, the company has dependably provided quality. Gabriel India is also regarded as the 'Pioneer of Ride Control and Comfort.
-
Following are the business segment of the company:
-
2&3 wheelers:
-
Having extensive expertise in the 2 & 3-Wheeler category, the Company has established itself as a strong contender in the 2W/3W EV area as well. Most premium manufacturers rely on us for front forks and rear shock absorbers.
-
Its top three customers are TVS Motors, Yamaha, and Bajaj Auto.
-
-
Passenger Cars:
-
Gabriel India is one of the market leaders in the passenger automobiles area, offering 300 types of highly precise ride control products and solutions.
-
Its top three players are Mararuti Suzuki, M&M, Volkswagen
-
-
Commercial Vehicle & Railways:
-
Gabriel India is the main maker of shock absorbers for commercial vehicles, with an 85% market share (CV). It supplies Linke Hofmaan Busch (LHB) coaches to the prestigious Indian Railways.
-
The top three players are Tata Motors, Ashok Leyland, and M&M.
-
-
Aftermarket:
-
The aftermarket caters to two and three-wheelers, passenger vehicles, and commercial vehicles. Gabriel India has built a significant brand equity and leadership position over the last 60 years, with a market share of more than 40%.
-
-
-
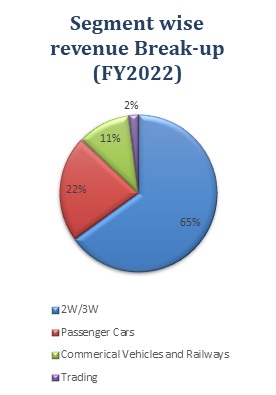
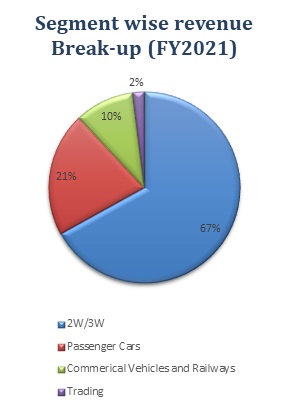
As per segment wise revenue from 2W&3W was 65%, from Passenger cars was 22%, Commercial Vehicles, and Railways was 11%, and from Trading was 2%, compared to 67%, 21%, 10%, and 2%.
-
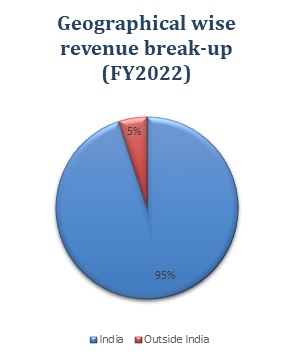
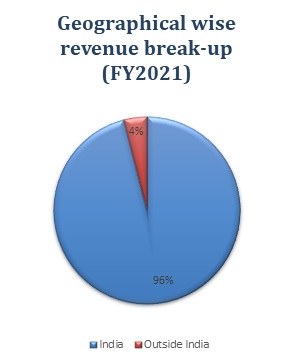
Geographically, revenue from India was 95% and from outside was 5%, compared to 96% and 4% in FY 2021.
SWOT ANALYSIS
STRENGTH
-
The company is net debt free
-
Diversified product portfolio
-
Experienced Management.
-
Company with Zero Promoter pledge.
WEAKNESS
-
Susceptibility to pricing pressure from OEMs and peers.
-
FIIs have decreased their shareholding.
OPPORTUNITIES
-
Favourable government policies.
-
Adoption of new technology.
-
Large-scale digitalization.
THREAT
-
Increasing pressure on costs and quality.
-
Product complexity and ever-changing market dynamics.
AUTO COMPONENTS INDUSTRY ANALYSIS
-
Based on domestic demand, notably from the passenger car sector, India's auto components industry saw a rise of 34.8% to ₹2.65 lakh crore in the first half of 2022–23.
-
Exports of components increased by 8.6% over the period to USD 10.1 billion (₹79.03 lakh crore), while imports increased by 17.2% to USD 10.1 billion (₹79.8 lakh crore).
-
The percentage of shipments to North America increased by 12% to 33% of the total. The proportions of Europe and Asia increased by 4% and 11%, respectively, to 30% and 26%, respectively.
-
By 2026, it is expected that the $13.3 billion in exports from the Indian auto component business would have increased to $80 billion. The USA, Germany, the United Kingdom, Thailand, and Italy are the main export markets.
-
India's car component industry had its highest-ever trade surplus in the fiscal year 2021–2022, at $700 million.
-
The aftermarket sector, which includes tyres, batteries, and brake parts, is expected to rise to $32 billion by 2026 from $9.8 billion in FY20.
-
By 2025, the whole Indian auto components market, which presently contributes 2.3% of India's GDP, is expected to overtake the United States as the third-largest market worldwide.
-
The Production-Linked Incentive (PLI) Program in the Automotive and Auto Components Sectors was launched by the Union Cabinet, which is presided over by Prime Minister Shri Narendra Modi. The PLI programme (with a $3.5 billion budget) for the automotive industry suggests financial incentives of up to 18% to encourage local production of high-tech automotive goods and draw capital to the industry's value chain.
-
On April 1, 2022, for a period of five years, incentives are applicable for specific sales of goods made in India. The programme came to an end on January 9, 2022. Under this PLI plan, a total of 95 candidates have been accepted: 20 under Champion OEM and 75 under Component champion.
Gabriel India Limited - FINANCIAL OVERVIEW
QUARTERLY SUMMARY
|
Quarterly (INR in Millions) |
Dec-22 |
Sep-22 |
Jun-22 |
Mar-22 |
Dec-21 |
|
Revenue from Operations |
7,109.86 |
8,028.72 |
7,209.03 |
6,843.28 |
6,061.42 |
|
Other income |
18.45 |
29.39 |
61.42 |
108.28 |
64.65 |
|
Total Income |
7,128.31 |
8,058.11 |
7,270.45 |
6,951.56 |
6,126.07 |
|
|
|
|
|
|
|
|
Total Expenditure |
6,722.98 |
7,555.41 |
6,812.07 |
6,572.77 |
5,749.97 |
|
EBIT |
405.33 |
502.70 |
458.38 |
378.79 |
376.10 |
|
|
|
|
|
|
|
|
Finance cost |
13.16 |
10.51 |
13.69 |
1.68 |
7.33 |
|
PBT |
392.17 |
492.19 |
444.69 |
377.11 |
368.77 |
|
|
|
|
|
|
|
|
Tax Expenses |
100.93 |
126.54 |
115.63 |
269.15 |
111.89 |
|
PAT |
291.24 |
365.65 |
329.06 |
107.96 |
256.88 |
Gabriel India Limited - PROFIT AND LOSS STATEMENT (₹ in Millions)
|
|
Mar-20 |
Mar-21 |
Mar-22 |
|
Revenue from operations |
18,699.62 |
16,948.33 |
23,319.89 |
|
Other income |
96.98 |
243.13 |
261.67 |
|
Total income |
18,796.60 |
17,191.46 |
23,581.56 |
|
|
|
|
|
|
Cost of goods sold |
13,696.95 |
12,652.83 |
17,863.03 |
|
Gross Profit |
5,099.65 |
4,538.63 |
5,718.53 |
|
|
|
|
|
|
Employee benefits |
1,553.48 |
1,474.08 |
1,597.00 |
|
Other expenses |
2,071.20 |
1,796.18 |
2,400.59 |
|
EBITDA |
1,474.97 |
1,268.37 |
1,720.94 |
|
|
|
|
|
|
Depreciation and Amortisation |
436.47 |
423.85 |
413.61 |
|
EBIT |
1,038.50 |
844.52 |
1,307.33 |
|
|
|
|
|
|
Finance cost |
35.80 |
65.45 |
42.74 |
|
EBT before exceptional items |
1,002.70 |
779.07 |
1,264.59 |
|
|
|
|
|
|
Exceptional item |
|
|
|
|
PBT |
1,002.70 |
779.07 |
1,264.59 |
|
|
|
|
|
|
Tax expenses |
155.62 |
176.34 |
369.44 |
|
PAT |
847.08 |
602.73 |
895.15 |
|
|
|
|
|
|
Basic EPS |
5.90 |
4.20 |
6.23 |
|
Diluted EPS |
5.90 |
4.20 |
6.23 |
|
|
|
|
|
|
Number of shares |
|
|
|
|
Basic |
143.57 |
143.51 |
143.64 |
|
Diluted |
143.57 |
143.51 |
143.64 |
|
|
|
|
|
Gabriel India Limited - Balance Sheet (₹ in Millions)
|
|
Mar-20 |
Mar-21 |
Mar-22 |
|
ASSETS: |
|
|
|
|
Non-current assets: |
|
|
|
|
Property, plant and Equipment |
3,372.38 |
3,342.03 |
3,689.11 |
|
Right-of-use assets |
71.79 |
138.02 |
113.34 |
|
Capital work-in-progress |
196.11 |
277.20 |
203.39 |
|
Investment property |
21.91 |
21.52 |
21.13 |
|
intangible assets |
20.25 |
25.05 |
30.82 |
|
Financial assets: |
|
|
|
|
Investments |
0.38 |
1.04 |
6.40 |
|
Loans |
13.20 |
8.93 |
10.51 |
|
Other financial assets |
571.52 |
89.29 |
97.58 |
|
Non-current tax assets |
304.62 |
76.50 |
66.75 |
|
Other Non-current assets |
104.76 |
195.81 |
219.12 |
|
Total Non-current assets |
4,676.92 |
4,175.39 |
4,458.15 |
|
|
|
|
|
|
Current assets: |
|
|
|
|
Inventories |
1,561.07 |
1,964.82 |
2,099.76 |
|
Financial assets: |
|
|
|
|
Investments |
351.44 |
150.67 |
831.61 |
|
Trade receivables |
2,332.81 |
2,793.03 |
3,824.02 |
|
Cash and cash equivalents |
8.42 |
128.96 |
410.00 |
|
Other bank balance |
558.18 |
781.29 |
135.67 |
|
Loans |
4.49 |
2.69 |
2.81 |
|
Other financial assets |
38.99 |
1,746.89 |
1,479.68 |
|
Other current assets |
200.72 |
211.35 |
289.25 |
|
Total Current assets |
5,056.12 |
7,779.70 |
9,072.80 |
|
|
|
|
|
|
Total assets |
9,733.04 |
11,955.09 |
13,530.95 |
|
|
|
|
|
|
EQUITY AND LIABILITIES: |
|
|
|
|
Equity: |
|
|
|
|
Share capital |
143.64 |
143.64 |
143.64 |
|
Other Equity |
6,374.16 |
6,819.47 |
7,524.15 |
|
Total Equity |
6,517.80 |
6,963.11 |
7,667.79 |
|
|
|
|
|
|
Non-current liabilities: |
|
|
|
|
Financial Liabilities: |
|
|
|
|
Borrowings |
78.23 |
- |
- |
|
Lease Liabilities |
- |
129.18 |
111.06 |
|
Other Non-current financial liabilities |
55.49 |
55.49 |
- |
|
Provisions |
121.55 |
138.57 |
147.82 |
|
Deferred Tax Liabilities |
80.15 |
105.36 |
144.59 |
|
Total Non-current Liabilities |
335.42 |
428.60 |
403.47 |
|
|
|
|
|
|
Current Liabilities: |
|
|
|
|
Financial Liabilities: |
|
|
|
|
Borrowings |
- |
- |
- |
|
Lease Liabilities |
- |
- |
- |
|
Trade payables: |
|
|
|
|
Total outstanding dues of micro and small enterprise |
15.78 |
354.57 |
815.30 |
|
Other creditors |
2,176.52 |
3,561.52 |
3,946.87 |
|
Other financial liabilities |
470.59 |
305.82 |
276.00 |
|
Other current liabilities |
74.53 |
188.15 |
246.65 |
|
Provisions |
142.40 |
135.83 |
156.95 |
|
Total Current Liabilities |
2,879.82 |
4,563.38 |
5,459.69 |
|
|
|
|
|
|
Total Equity and Liabilities |
9,733.04 |
11,955.09 |
13,530.95 |
Gabriel India Limited - Cash Flow Statement (₹ in Millions)
|
|
Mar-20 |
Mar-21 |
Mar-22 |
|
Net Profit Before Tax |
1,002.70 |
779.07 |
1,264.59 |
|
Net Cash from Operating Activities |
1,201.32 |
2,038.84 |
964.58 |
|
Net Cash Used for Investing Activities |
-962.22 |
-1,701.41 |
-442.48 |
|
Net Cash From (Used For) Financing Activities |
-278.50 |
-216.89 |
-241.06 |
|
Net Increase in Cash and Cash Equivalents |
-39.40 |
120.54 |
281.04 |
|
Cash And Cash Equivalents at The Beginning of The Year |
47.82 |
8.42 |
128.96 |
|
Cash And Cash Equivalents at The End of the Year |
8.42 |
128.96 |
410.00 |
Gabriel India Limited - Ratio Analysis
|
|
Mar-20 |
Mar-21 |
Mar-22 |
|
Profitability Ratio |
|
|
|
|
Gross Profit |
27.27% |
26.78% |
24.52% |
|
EBITDA Margin |
7.89% |
7.48% |
7.38% |
|
EBIT Margin |
5.55% |
4.98% |
5.61% |
|
Pre-Tax Margin |
5.36% |
4.60% |
5.42% |
|
Net Profit Margin |
4.53% |
3.56% |
3.84% |
|
|
|
|
|
|
Return on Investment |
|
|
|
|
Return on Asset – ROA |
9% |
6% |
7% |
|
Return on Capital Employed – ROCE |
16% |
12% |
17% |
|
Return on Equity – ROE |
14% |
9% |
12% |
|
|
|
|
|
|
Liquidity Ratio (x) |
|
|
|
|
Current ratio |
1.76 |
1.70 |
1.66 |
|
Quick Ratio |
1.21 |
1.27 |
1.28 |
|
|
|
|
|
|
Turnover Ratio |
|
|
|
|
Receivables Turnover |
7.2 |
6.6 |
7.4 |
|
Inventory Turnover |
8.5 |
7.2 |
7.4 |
|
Payables Turnover |
5.8 |
4.4 |
4.1 |
|
Asset Turnover |
1.9 |
1.6 |
1.8 |
|
|
|
|
|
|
Solvency Ratio |
|
|
|
|
Debt to Equity |
0.01 |
0.00 |
0.00 |
|
Interest Coverage Ratio |
29 |
13 |
31 |
Gabriel India Limited - Technical Analysis
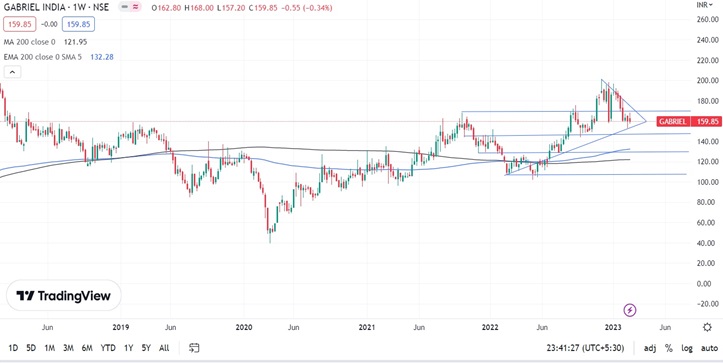
-
Stock is trading above Moving Average 200 Days with a support level of ₹130 and a resistance level of ₹169.
-
At these prices, one may buy more of this stock.
Recommendation Rationale
-
Healthy Financial Risk Profile:
-
In fiscal 2023, the financial risk profile has continued to improve, with net debt as of December 31, 2022.
-
In the absence of any major, debt-financed capital expenditures, the financial risk profile is likely to stay stable. Additionally, exposure to group firms is expected to be minimal.
-
-
Improving Operating Efficiencies:
-
Return on capital employed (ROCE) will continue at over 17% until fiscal 2022. Nevertheless, due to margin moderation in fiscal 2021, ROCE fell to 12%. Moving forward, with the operating margin is expected to improve, ROCE will rise to more than 20%.
-
Nonetheless, increased sales in the aftermarket segment have helped to keep margins stable and have somewhat offset the impact of raw material cost volatility.
-
Additionally, long-standing technological collaborations with worldwide firms including Yamaha Motor Hydraulic System Co Ltd, KYB Spain, and Kayaba Industrial Co improve product development capabilities.
-
-
Diversified customer and Revenue Mix Segment:
-
GIL is one of India's leading companies in the vehicle suspension component category, having a presence in OEMs, aftermarket, and export markets, as well as 20000 retailers throughout all six continents. Also, a varied customer dispersed throughout segments ensures income stability.
-
-
Improving Market share and position in EV Segment:
-
Gabriel has been working hard to get into the EV market. Presently, the EV industry contributes 4-5% to the top line and accounts for 9% of sales in the 2W category. Gabriel has a 60% market share in the electric 2W suspension industry since it serves all of the main 2W companies.
-
Beyond 2Ws, the business has begun to sell electric bicycles. Gabriel is already producing MTB front forks for Hero e-bikes and plans to grow its client base in the e-bike category over the coming year. Throughout the time, management expects the e-bike market to provide an export potential between Rs. 20 crores to Rs. 50 crores.
-
Valuation
-
Gabriel India Limited has shown revenue growth of 6% CAGR for FY2018-2022.
-
There was a de-growth in the profit of the company in the years 2020 and 2021, which was impacted due covid-19 and the increase in the prices of raw-material. Net profit improved in the year 2022 with improvement in the automobile sector and opening the market after the second wave of covid-19. we further expected net profit will improve in FY2023.
-
The company’s ROE and ROCE are 12% & 17% for FY2022.
-
Based on the firm's current performance in FY 2022, we predict that the company might create more revenue for the next FY 2023.
-
To project income for the fiscal years 2023–2027, we used data from the previous five years (2018–2022).
Estimated Income Statement (₹ in Millions)
|
|
Mar-23 |
Mar-24 |
Mar-25 |
Mar-26 |
Mar-27 |
|
|
2023-E |
2024-E |
2025-E |
2026-E |
2027-E |
|
Revenue |
25,399.31 |
34,858.38 |
47,869.02 |
65,766.18 |
90,386.66 |
|
COGS |
19,001.11 |
26,144.39 |
35,973.12 |
49,496.87 |
68,104.74 |
|
Gross Profit |
6,398.20 |
8,713.99 |
11,895.89 |
16,269.31 |
22,281.93 |
|
Excise Duty |
- |
- |
- |
- |
- |
|
Employee Expenses |
1,952.90 |
2,687.07 |
3,697.25 |
5,087.19 |
6,999.67 |
|
Other Expenses |
2,624.53 |
3,611.20 |
4,968.79 |
6,836.76 |
9,406.97 |
|
EBITDA |
1,820.77 |
2,415.72 |
3,229.86 |
4,345.36 |
5,875.28 |
|
Depreciation |
438.49 |
455.94 |
496.19 |
566.01 |
674.94 |
|
EBIT |
1,382.28 |
1,959.78 |
2,733.67 |
3,779.34 |
5,200.34 |
|
Financial Cost |
45.19 |
64.07 |
89.37 |
123.56 |
170.01 |
|
EBT |
1,337.09 |
1,895.71 |
2,644.30 |
3,655.79 |
5,030.33 |
|
Tax expenses |
334.27 |
473.93 |
661.07 |
913.95 |
1,257.58 |
|
PAT |
1,002.82 |
1,421.78 |
1,983.22 |
2,741.84 |
3,772.75 |
Disclaimer: This report is only for the information of our customer Recommendations, opinions, or suggestions are given with the understanding that readers acting on this information assume all risks involved. The information provided herein is not to be construed as an offer to buy or sell securities of any kind.
- Share :


Post a Comment
|
DISCLAIMER |
This report is only for the information of our customers. Recommendations, opinions, or suggestions are given with the understanding that readers acting on this information assume all risks involved. The information provided herein is not to be construed as an offer to buy or sell securities of any kind. ATS and/or its group companies do not as assume any responsibility or liability resulting from the use of such information.