Finolex Cables Ltd.
|
Current price |
274.70 |
|
Sector |
Cables |
|
No of shares |
152939345 |
|
52 week high |
306.40 |
|
52 week low |
117.10 |
|
BSE Sensex |
27396.38 |
|
Nifty |
8285.60 |
|
Average Volume |
229218 |
|
BSE Code |
500144 |
|
NSE Symbol |
FINCABLES |
Finolex Cables Ltd - Company Overview
Finolex Cables Ltd, the flagship company of the Finolex Group was established in 1958 in Pune. Today, it is India's largest and leading manufacturer of electrical and telecommunication cables with a turnover in excess of Rs.16 Billion (about US $ 320 million).
The company started its operation with the manufacture of PVC insulated electrical cables for the automobile industry. Since then the Company operates in two segments namely Electrical Cables and Communication Cables. Electrical cables segment includes the manufacture of 1100 V PVC insulated cables, motor winding PVC insulated cables and three core flat cables, automotive/battery cables, universal power supply (UPS) cables, heavy duty, underground, low voltage, power and control cables, and heavy duty, underground, high voltage and power Cables. Its Communication cables segment include jelly filled telephone cables, local area network (LAN) cables, PE insulated telephone cables (switchboard cables), coaxial cables, optic fiber V-SAT cables and optic fiber cables. Its Copper Rods includes CCC rods of 8 mm diameter; electrical switches, which include premium and classic switches, sockets and regulators, and lamps include retrofit and non-retrofit compact fluorescent lamp lamps, as well as T5 tube lights and fittings. FC is currently in advanced stages of entering the domestic switchgear market and management believes that they could leverage their current distribution strength of over 4,000 dealers to make a foray in this market. Overall, the switchgear market size is estimated by management to be c.INR 60bn
The company has manufacturing facilities at Pimpri and Urse in Pune as well as at Goa & Uttarakhand. The company has, over the years, established its reputation as an innovative leader and quality manufacturer by continuously upgrading technology, modernizing manufacturing facilities and maintaining highest standards of quality and services. Today, the name Finolex has become synonymous with Quality and enjoys overwhelming confidence of the customers. Investors have also fancied its stock in view of its phenomenal progress leading to a manifold increase on investment in stock through the years. The current market capitalisation stands at Rs.4239.48 crore.
Finolex Cables Ltd - Share Holding Pattern
Financial Details
-
Market Cap (Rs Cr) – 4239.48
-
Company P/E (x) – 19.17
-
Industry P/E (x) – 22.84
-
Book Value (Rs) – 72.18
-
Price / BV (x) – 3.84
-
Dividend (%) – 80 %
-
EPS (TTM) – 14.46
-
Dividend Yield (%) – 0.58 %
-
Face Value (Rs) – 2
Finolex Cables Ltd - Industry overview
Cable and wire industry has established itself as one of the backbones of modern information age. The increasing importance for power, light and communication has kept demand high for wire and cable. This trend will continue as demand for reliable, efficient energy and data communications will strengthen the wire and cable industry. The industry is a volume-driven product and has evolved from the unorganised to the organised sector. However, about 35 per cent of this industry is still in the unorganised.
About 40 per cent of the entire electrical industry is composed by wire and cable industry, and it is expected to be double in the next 5 years. The global wire and cable market is valued at $127 billion in 2010. This market is expected to increase at a 9. 4 per cent CAGR to reach nearly $200 billion in 2015. Due to the good response from the power and infrastructure segments, the wire and cable industry is growing at a CAGR of 15 per cent. As the new government is focusing on „Make In India,” the industry can grow at similar rate for the next 5 years.
Investment made by various private companies in power sector has opened up the wire and cable industry. Even the growth potential in the telecom sector as well as the various policy pronouncements by the government towards bringing about improved digital connectivity has added advantage to the industry. The rollout of 4G and broadband on a pan-India basis is an important growth driver because this will boost the market. Government impetus in refineries, power, and fertilizers will offer a boost to the cable industry as almost all manufacturing companies need cables. The auto sector and railways are also important sectors consuming wires and cables on a large scale. The power sector is the biggest driver in the mainstay of cable demand, accounting for more than three-quarters of the market. Telecom cables are confined to the relatively narrower domain of the health of the global information, communications, and technology (ICT) domains. For the industry, the current focus is to supply cables for specific applications, pertaining to the industry needs. Sectors like oil and gas, metro, cement industry, and steel industry have a lot of growth potential. The wire and cable industry is also focusing on specialized cables like extra-high-voltage cables and elastomer cables, which are now used for special applications in the industries like oil and gas, shipbuilding, construction equipment, elevator, renewable power, windmill solutions, security systems, and so forth.
The biggest challenge for the industry is operation and service, including the reduced lifetime of cables due to mishandling and deployment times. Increasing price and competition from Chinese imports is also one of the biggest challenges for the industry. The rising price of copper has also become a major issue as it has squeezed the profit margins, and copper has become uncompetitive in the international market.
Balance Sheet
|
|
Mar '14 |
Mar '13 |
Mar '12 |
Mar '11 |
Mar '10 |
|
Sources Of Funds |
|
|
|
|
|
|
Total Share Capital |
30.59 |
30.59 |
30.59 |
30.59 |
30.59 |
|
Equity Share Capital |
30.59 |
30.59 |
30.59 |
30.59 |
30.59 |
|
Reserves |
1,072.78 |
893.73 |
769.84 |
686.89 |
612.52 |
|
Networth |
1,103.37 |
924.32 |
800.43 |
717.48 |
643.11 |
|
Secured Loans |
125.00 |
143.09 |
134.26 |
243.99 |
246.57 |
|
Unsecured Loans |
1.69 |
19.17 |
20.28 |
16.06 |
28.55 |
|
Total Debt |
126.69 |
162.26 |
154.54 |
260.05 |
275.12 |
|
Total Liabilities |
1,230.06 |
1,086.58 |
954.97 |
977.53 |
918.23 |
|
Application Of Funds |
|
|
|
|
|
|
Gross Block |
1,048.36 |
916.38 |
871.37 |
825.70 |
802.46 |
|
Less: Accum. Depreciation |
552.52 |
504.27 |
442.14 |
422.37 |
383.70 |
|
Net Block |
495.84 |
412.11 |
429.23 |
403.33 |
418.76 |
|
Capital Work in Progress |
10.70 |
35.73 |
13.28 |
30.63 |
28.83 |
|
Investments |
403.14 |
324.09 |
237.21 |
245.15 |
280.28 |
|
Inventories |
352.40 |
329.63 |
281.14 |
280.84 |
220.95 |
|
Sundry Debtors |
145.17 |
149.65 |
114.09 |
129.34 |
71.05 |
|
Cash and Bank Balance |
64.86 |
39.81 |
32.70 |
21.28 |
26.93 |
|
Total Current Assets |
562.43 |
519.09 |
427.93 |
431.46 |
318.93 |
|
Loans and Advances |
91.86 |
113.12 |
94.68 |
104.63 |
85.72 |
|
Fixed Deposits |
0.00 |
0.00 |
16.30 |
0.00 |
10.23 |
|
Total CA, Loans & Advances |
654.29 |
632.21 |
538.91 |
536.09 |
414.88 |
|
Current Liabilities |
243.03 |
238.24 |
244.68 |
220.83 |
209.95 |
|
Provisions |
90.88 |
79.32 |
18.98 |
16.85 |
14.56 |
|
Total CL & Provisions |
333.91 |
317.56 |
263.66 |
237.68 |
224.51 |
|
Net Current Assets |
320.38 |
314.65 |
275.25 |
298.41 |
190.37 |
|
Total Assets |
1,230.06 |
1,086.58 |
954.97 |
977.52 |
918.24 |
|
Contingent Liabilities |
413.90 |
536.65 |
188.73 |
204.80 |
209.21 |
|
Book Value (Rs) |
72.14 |
60.44 |
52.34 |
46.91 |
42.05 |
Profit and Loss Account
|
|
Mar '14 |
Mar '13 |
Mar '12 |
Mar '11 |
Mar '10 |
|
Income |
|
|
|
|
|
|
Sales Turnover |
2,359.04 |
2,270.68 |
2,182.43 |
2,186.36 |
1,726.60 |
|
Excise Duty |
0.00 |
0.00 |
121.05 |
153.36 |
111.38 |
|
Net Sales |
2,359.04 |
2,270.68 |
2,061.38 |
2,033.00 |
1,615.22 |
|
Other Income |
58.73 |
1.16 |
-12.87 |
-8.38 |
-49.62 |
|
Stock Adjustments |
21.53 |
29.68 |
-13.64 |
63.73 |
65.25 |
|
Total Income |
2,439.30 |
2,301.52 |
2,034.87 |
2,088.35 |
1,630.85 |
|
Expenditure |
|
|
|
|
|
|
Raw Materials |
1,807.55 |
1,739.29 |
1,595.95 |
1,680.60 |
1,282.84 |
|
Power & Fuel Cost |
37.07 |
40.69 |
32.57 |
33.24 |
29.11 |
|
Employee Cost |
84.83 |
84.59 |
69.32 |
64.41 |
58.88 |
|
Other Manufacturing Expenses |
0.00 |
0.00 |
2.22 |
1.62 |
1.97 |
|
Selling and Admin Expenses |
0.00 |
0.00 |
152.48 |
125.74 |
98.02 |
|
Miscellaneous Expenses |
202.93 |
206.13 |
16.71 |
18.16 |
15.81 |
|
Preoperative Exp Capitalised |
0.00 |
0.00 |
-0.95 |
-0.51 |
-0.87 |
|
Total Expenses |
2,132.38 |
2,070.70 |
1,868.30 |
1,923.26 |
1,485.76 |
|
Operating Profit |
248.19 |
229.66 |
179.44 |
173.47 |
194.71 |
|
PBDIT |
306.92 |
230.82 |
166.57 |
165.09 |
145.09 |
|
Interest |
14.48 |
13.38 |
17.83 |
19.13 |
18.69 |
|
PBDT |
292.44 |
217.44 |
148.74 |
145.96 |
126.40 |
|
Depreciation |
48.43 |
46.63 |
39.47 |
38.78 |
37.23 |
|
Profit Before Tax |
244.01 |
170.81 |
109.27 |
107.18 |
89.17 |
|
PBT (Post Extra-ord Items) |
244.01 |
170.81 |
109.27 |
107.22 |
80.45 |
|
Tax |
36.33 |
25.54 |
11.08 |
20.41 |
22.83 |
|
Reported Net Profit |
207.68 |
145.27 |
98.19 |
86.78 |
57.63 |
|
Total Value Addition |
324.83 |
331.41 |
272.35 |
242.66 |
202.92 |
|
Equity Dividend |
24.47 |
18.35 |
12.24 |
10.71 |
9.18 |
|
Corporate Dividend Tax |
4.16 |
3.03 |
1.98 |
1.74 |
1.56 |
|
Per share data (annualised) |
|
|
|
|
|
|
Shares in issue (lakhs) |
1,529.39 |
1,529.39 |
1,529.39 |
1,529.39 |
1,529.39 |
|
Earning Per Share (Rs) |
13.58 |
9.50 |
6.42 |
5.67 |
3.77 |
|
Equity Dividend (%) |
80.00 |
60.00 |
40.00 |
35.00 |
30.00 |
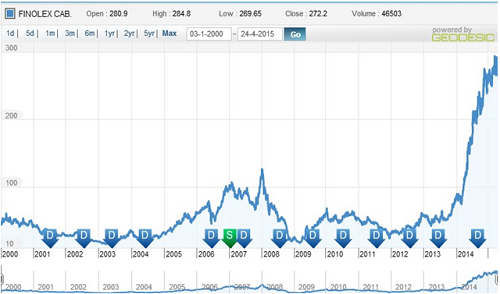
Dividend History
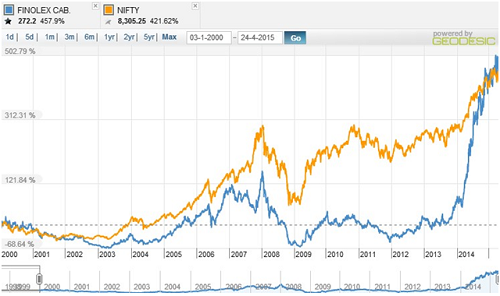
Index and Company Price Movement Comparison
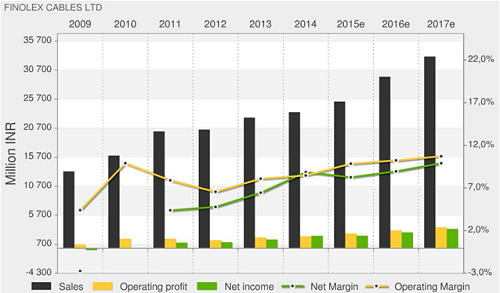
Company Forecast
Technical Indicators
|
Name |
Value |
Action |
|
RSI(14) |
60.084 |
Buy |
|
STOCH(9,6) |
61.913 |
Buy |
|
STOCHRSI(14) |
95.341 |
Overbought |
|
MACD(12,26) |
0.590 |
Buy |
|
ADX(14) |
35.871 |
Sell |
|
Williams %R |
-3.378 |
Overbought |
|
CCI(14) |
147.4718 |
Buy |
|
ATR(14) |
2.9000 |
Less Volatility |
|
Highs/Lows(14) |
5.5143 |
Buy |
|
Ultimate Oscillator |
70.346 |
Overbought |
|
ROC |
0.416 |
Buy |
|
Bull/Bear Power(13) |
8.6880 |
Buy |
Important Ratios (YoY)
-
PBIT – 8.29 v/s 7.97
-
RoCE – 20.17 v/s 19.06
-
RoE – 20.48 v/s 16.85
-
Net Profit Margin – 8.62 v/s 6.33
-
Return on net worth – 18.82 v/s 15.71
-
D/E Ratio – 0.11 v/s 0.18
-
Interest Cover – 17.13 v/s 15.49
-
Current Ratio – 1.96 v/s 1.89
-
Reserves – 1072.78 cr v/s 893.73 cr
-
PAT – 207.68 cr v/s 145.27 cr
-
Total assets – 1230.06 cr v/s 1086.58 cr
-
Net sales – 2359.04 cr v/s 2270.68 cr
-
Book Value – 72.14 v/s 60.44
Simple Moving Average
|
Days |
BSE |
NSE |
|
30 |
279.13 |
279.38 |
|
50 |
275.64 |
275.86 |
|
150 |
256.51 |
256.73 |
|
200 |
244.28 |
244.49 |
Investment Rationalize
-
Finolex Cables Ltd. is amongst the most trusted and largest player in electrical and telecommunication cables in India with well diversified products mix and with a market capitalization of Rs.4239 crore.
-
Backward integration helps the company in order to reduce the cost of raw materials as well as to maintain high of quality and increase its profits margins.
-
Finolex Cables is having 19 warehouses, which will help the company in order to reduce the logistics expenses and an impressive network of more than 4000 distributers and 30000 dealers to sell its products and services.
-
Government initiative of “Make in India” will provide a good growth opportunity along with the improvement in Auto, Industrial, State Electricity Boards and Housing sectors will increase the revenue of the company as most its revenue comes from B2B (Business to Business) transactions.
-
Entry into Switchgear segment of the market will provide a good growth opportunity to the company as major market share is held by unorganized players and few major players.
-
Modernization of telecommunication equipments and entry of 4G via optifibre cables will act as a trigger for the next level growth of the company.
-
Profit Before Tax is growing at a CAGR of 22.3% and Net Profit at a CAGR of 29.2% in the last five years instead of adverse market situations. And Net Profit Margin is at 8.8% and Return on Equity stands at 20.48%.
-
Company have reduced debt significantly and have more than 85% of its assets as reserve, which can be used for expansion plans.
- Share :


Post a Comment
|
DISCLAIMER |
This report is only for the information of our customers. Recommendations, opinions, or suggestions are given with the understanding that readers acting on this information assume all risks involved. The information provided herein is not to be construed as an offer to buy or sell securities of any kind. ATS and/or its group companies do not as assume any responsibility or liability resulting from the use of such information.