Maan Aluminium Limited
Q2FY2024 REVIEW
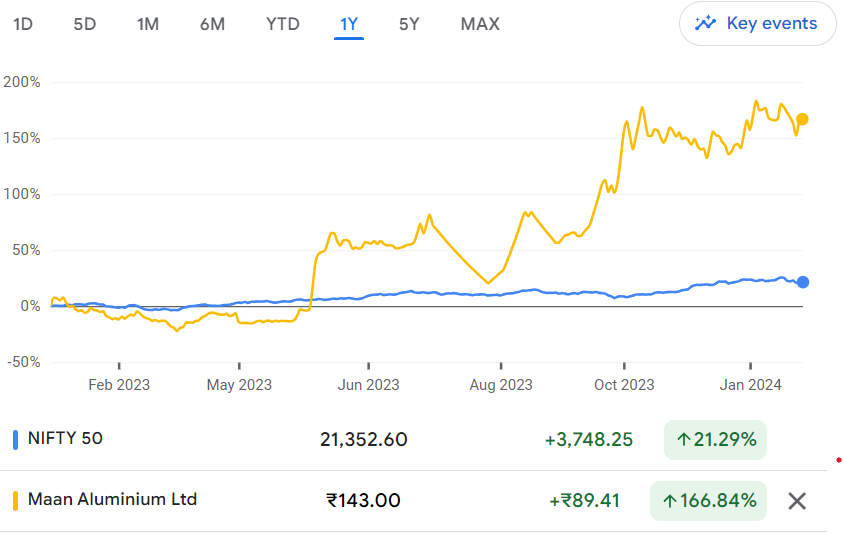
Maan Aluminium Limited reported net revenue of ₹295.30 crores for the quarter ended September 30, 2023, compared to ₹188.20 crores for September 30, 2022. Profit After Tax was ₹10.64 crores for the quarter ended September 30, 2023, against the profit of ₹17.64 crores during the corresponding quarter of the previous year, respectively.
- On July 19, 2023, the company passed a resolution for the subdivision/split of equity shares, changing the structure from 1 (one) equity share with a face value of Rs. 10 each to 2 (two) equity shares with a face value of Rs. 5 each.
BENCHMARK COMPARISON
Beta: 0.89 |
Alpha: 145.55 |
Risk Reward Ratio: 2.01 |
Margin of Safety: 33% |
STOCK DATA
|
52 Week H/L |
41/159 |
|
Market Cap (crores) |
772 |
|
Face Value (₹) |
5.00 |
|
Book Value |
96.35 |
|
EPS TTM |
9.24 |
|
NSE Code |
MAANALU |
SHAREHOLDING PATTERN (%)
|
|
Jun-23 |
Sep-23 |
Dec-23 |
|
Promoter |
65.38 |
60.71 |
60.71 |
|
Public |
33.94 |
39.08 |
39.13 |
|
DIIs |
0.00 |
0.00 |
0.00 |
|
FIIs |
0.67 |
0.18 |
0.15 |
BUSINESS
- Maan Aluminium Limited, established in 1989, operates in the manufacturing and trading sectors, specializing in products such as aluminium profiles, aluminium ingots, and aluminium billets. The company is actively engaged in various related activities. Presently, Maan serves as an independent dealer for Aluminium ingots and Billets on behalf of Hindalco Industries Ltd., covering regions in North and South India. Additionally, the company participates in the scrap trade, particularly focusing on non-ferrous metals such as Taint Tabor, Tread, Talk, Twitch, Tense, and Zorba.
- In 2009, the company underwent a rebranding process and emerged as Maan Aluminium Ltd. Following this transformation, the scope of its operations expanded to encompass the trading of Ingot/Billets. Notably, the company is listed on the Stock Exchanges in India, including both the National Stock Exchange (NSE) and the Bombay Stock Exchange (BSE).
- The company operates a single plant located in the Pithampur Industrial Area, Pithampur, Madhya Pradesh. In the fiscal year 2020-21, the company achieved a production output of 6,960 metric tons (MT). The installed annual capacity of the plant is 9,000 MT, indicating a capacity utilization rate of 77%, which is an improvement from the 71% recorded in the previous fiscal year (FY20).
- The annual production and key business details:
- Annual Production:
- FY 2021: 6,960 MT
- FY 2022: 7,569 MT
- FY 2023: 9,127 MT
- Market Presence:
- The company caters to markets in India, USA, UK, Middle East, Sri Lanka, Israel, and Hong Kong.
- Export Ratio:
- Solar: 34%
- Hardware: 58%
- Others: 8%
- Green Energy Initiatives:
- The company incorporates sustainable practices by utilizing 25% of total power consumption from solar energy.
- Annual Production:
SWOT ANALYSIS
STRENGTH
- Product Portfolio.
- Strong Market presence.
- Financial Stability.
WEAKNESS
- Dependency on Supplier.
- Limited Geographic Presence.
OPPORTUNITIES
- Global Expansion.
- Market Presence.
- Technological Advancement.
THREAT
- Market Competition.
- Raw Material Prices.
ALUMINIUM INDUSTRY ANALYSIS
- The aluminum market is witnessing strong growth owing to its recyclable and environmentally friendly characteristics, finding applications in diverse sectors such as power, transportation, construction, and packaging.
- This upswing is attributed to global economic stimulus, a constrained scrap market, a metal-intensive recovery post-pandemic, and a shift towards eco-friendly materials. Aluminum, being favored in the ongoing green revolution, is anticipated to experience heightened demand, particularly from Western and Asian markets. Key end-users encompass the engineering sector, transportation, construction, packaging, and consumer durables.
- While Western demand is spread across sectors, India experiences concentration in the electrical and electronics industry. As the world's second-largest metal market after iron and steel, aluminum exhibits a positive outlook, with domestic demand projected to grow around 9% in the next two fiscal years.
- India's automotive sector, a significant consumer, is expected to sustain steady demand in FY2024 and FY2025, with the potential for increased usage due to weight reduction initiatives for fuel efficiency and the gradual transition to electric vehicles. Moreover, improvements in global metal supply, particularly in China, may result in a surplus metal balance in the current year, despite challenges in the Chinese building and construction segments affecting consumption.
- The anticipated surge in the demand for aluminum in India over the next few years is expected to be significantly higher, driven by the projected high GDP growth in the country. Various initiatives undertaken by the Government of India, such as Make in India, 100% rural electrification, Housing for All, Smart Cities, the National Infrastructure Pipeline amounting to Rs 100 lakh Crore, promotion of renewable energy, and schemes like FAME for electric vehicles, coupled with an increase in foreign direct investment (FDI), are poised to stimulate the consumption of this metal across the nation.
- The production of aluminum in India, measured in lakh tonnes, is as follows for the specified years:

FINANCIAL OVERVIEW
QUARTERLY SUMMARY
|
Quarterly (INR in lakhs) |
Sep-23 |
Jun-23 |
Mar-23 |
Dec-22 |
Sep-22 |
|
Revenue from Operations |
29,530.00 |
20,736.00 |
26,287.00 |
18,962.00 |
18,820.00 |
|
Other income |
155.00 |
216.00 |
150.00 |
126.00 |
134.00 |
|
Total Income |
29,685.00 |
20,952.00 |
26,437.00 |
19,088.00 |
18,954.00 |
|
|
|
|
|
|
|
|
Total Expenditure |
28,540.00 |
19,507.00 |
24,339.00 |
17,114.00 |
17,056.00 |
|
EBIT |
1,145.00 |
1,445.00 |
2,098.00 |
1,974.00 |
1,898.00 |
|
|
|
|
|
|
|
|
Finance cost |
81.00 |
88.00 |
162.00 |
99.00 |
134.00 |
|
PBT before Share of Net Profit of Associate |
1,064.00 |
1,357.00 |
1,936.00 |
1,875.00 |
1,764.00 |
|
|
|
|
|
|
|
|
Share of Net Profit of Associate |
- |
- |
- |
- |
- |
|
PBT before Exceptional Item |
1,064.00 |
1,357.00 |
1,936.00 |
1,875.00 |
1,764.00 |
|
|
|
|
|
|
|
|
Exceptional Item |
- |
- |
- |
- |
- |
|
PBT |
1,064.00 |
1,357.00 |
1,936.00 |
1,875.00 |
1,764.00 |
|
|
|
|
|
|
|
|
Tax Expenses |
276.00 |
342.00 |
490.00 |
474.00 |
454.00 |
|
PAT |
788.00 |
1,015.00 |
1,446.00 |
1,401.00 |
1,310.00 |
PROFIT AND LOSS STATEMENT (₹ in lakhs)
|
|
Mar-21 |
Mar-22 |
Mar-23 |
|
Revenue from Operations |
40,287.61 |
57,229.17 |
81,385.49 |
|
Other Income |
245.24 |
525.14 |
515.61 |
|
Total Income |
40,532.85 |
57,754.31 |
81,901.10 |
|
|
|
|
|
|
Cost of Goods Sold |
34,110.15 |
47,294.63 |
63,219.13 |
|
Employee Benefits Expense |
962.55 |
1,148.67 |
1,575.67 |
|
Other Expenses |
2,764.55 |
5,500.87 |
9,461.66 |
|
EBITDA |
2,695.60 |
3,810.14 |
7,644.64 |
|
|
|
|
|
|
Depreciation and Amortisation Expense |
388.16 |
488.33 |
494.71 |
|
EBIT |
2,307.44 |
3,321.81 |
7,149.93 |
|
|
|
|
|
|
Finance Costs |
320.05 |
346.83 |
446.65 |
|
EBT before Share of Profit/(Loss) of Joint Venture and Associates |
1,987.39 |
2,974.98 |
6,703.28 |
|
|
|
|
|
|
Share of Profit/(Loss) of Joint Venture and Associates |
- |
- |
- |
|
EBT before Exceptional Items |
1,987.39 |
2,974.98 |
6,703.28 |
|
|
|
|
|
|
Exceptional Items |
- |
- |
- |
|
EBT |
1,987.39 |
2,974.98 |
6,703.28 |
|
|
|
|
|
|
Tax Expense |
507.78 |
777.07 |
1,706.18 |
|
PAT Non-Controlling Interests |
1,479.61 |
2,197.91 |
4,997.10 |
|
|
|
|
|
|
Non-Controlling Interests |
- |
- |
- |
|
|
|
|
|
|
PAT |
1,479.61 |
2,197.91 |
4,997.10 |
|
|
|
|
|
|
EPS |
|
|
|
|
Basic |
2.74 |
4.06 |
9.24 |
|
Diluted |
2.74 |
4.06 |
9.24 |
|
|
|
|
|
|
Number of Shares |
|
|
|
|
Basic |
540.84 |
540.84 |
540.84 |
|
Diluted |
540.84 |
540.84 |
540.84 |
Note: The company passed a resolution to subdivide/split its equity shares, changing the face value from Rs. 10 each to Rs. 5 each, and subsequently issued bonus shares at a 1:1 ratio for every existing fully paid-up Equity Share held by a member. This adjustment has been factored into the calculation of the weighted average number of equity shares for all comparative periods in accordance with Ind AS 3. Consequently, both basic and diluted EPS have been adjusted for all presented periods.
Balance Sheet (₹ lakhs)
|
|
Mar-21 |
Mar-22 |
Mar-23 |
|
ASSETS: |
|
|
|
|
Non-Current Assets: |
|
|
|
|
Property, Plant and Equipment |
3,609.11 |
4,439.52 |
4,979.97 |
|
Right-of-Use-Asset |
113.25 |
93.26 |
106.47 |
|
Capital Work in Progress |
40.14 |
39.18 |
84.77 |
|
Intangible Assets Under Development |
- |
- |
- |
|
Financial Assets: |
|
|
|
|
Investments |
0.50 |
0.50 |
0.50 |
|
Loans |
- |
- |
- |
|
Other Financial Assets |
- |
68.84 |
97.00 |
|
Other Non-Current Assets |
134.15 |
54.54 |
100.28 |
|
Total Non-Current Assets |
3,897.15 |
4,695.84 |
5,368.99 |
|
|
|
|
|
|
Current Assets: |
|
|
|
|
Inventories |
3,268.19 |
3,719.05 |
3,495.32 |
|
Financial Assets: |
|
|
|
|
Investments |
- |
- |
50.00 |
|
Trade Receivables |
6,243.80 |
7,266.49 |
11,559.41 |
|
Cash and Cash Equivalents |
613.34 |
9.73 |
8.70 |
|
Other Bank Balances |
472.03 |
141.39 |
234.39 |
|
Other Financial Assets |
18.41 |
59.49 |
319.60 |
|
Current Tax Assets |
12.11 |
10.74 |
10.74 |
|
Other Current Assets |
1,498.07 |
1,241.51 |
1,441.73 |
|
Total Current Assets |
12,125.95 |
12,448.40 |
17,119.89 |
|
|
|
|
|
|
Total Assets |
16,023.10 |
17,144.24 |
22,488.88 |
|
|
|
|
|
|
EQUITY AND LIABILITIES: |
|
|
|
|
Equity: |
|
|
|
|
Equity Share Capital |
676.06 |
1,352.12 |
1,352.12 |
|
Other Equity |
5,729.86 |
7,085.20 |
11,675.39 |
|
Equity Attributable to the Owners |
6,405.92 |
8,437.32 |
13,027.51 |
|
|
|
|
|
|
Non-Controlling Interest |
- |
- |
- |
|
Total Equity |
6,405.92 |
8,437.32 |
13,027.51 |
|
|
|
|
|
|
Liabilities: |
|
|
|
|
Non-Current Liabilities: |
|
|
|
|
Financial Liabilities |
|
|
|
|
Borrowings |
313.93 |
323.65 |
103.05 |
|
Lease Liabilities |
61.29 |
50.77 |
59.96 |
|
Provisions |
54.76 |
44.17 |
36.83 |
|
Deferred Tax Liabilities |
242.43 |
268.69 |
272.21 |
|
Total Non-Current Liabilities |
672.41 |
687.28 |
472.05 |
|
|
|
|
|
|
Current Liabilities: |
|
|
|
|
Financial Liabilities: |
|
|
|
|
Borrowings |
6,916.15 |
6,166.28 |
5,422.52 |
|
Lease Liabilities |
23.94 |
19.11 |
25.29 |
|
Trade Payables: |
|
|
|
|
Total outstanding dues of micro enterprises and small enterprises |
92.68 |
43.22 |
81.12 |
|
Other Creditors |
1,275.30 |
1,093.40 |
2,946.44 |
|
Other Financial Assets |
185.67 |
128.36 |
133.58 |
|
Other Current Liabilities |
321.52 |
302.51 |
218.84 |
|
Provisions |
94.19 |
92.50 |
109.06 |
|
Current Tax Liabilities |
35.32 |
174.26 |
52.47 |
|
Total Current Liabilities |
8,944.77 |
8,019.64 |
8,989.32 |
|
|
|
|
|
|
Total Equity & Liabilities |
16,023.10 |
17,144.24 |
22,488.88 |
Cash Flow Statement (₹ lakhs)
|
|
Mar-21 |
Mar-22 |
Mar-23 |
|
Net Profit Before Tax |
1,987.37 |
2,974.98 |
6,703.28 |
|
Net Cash from Operating Activities |
-1,949.19 |
1,509.70 |
2,902.36 |
|
Net Cash Used for Investing Activities |
-1,235.31 |
-732.41 |
-1,016.91 |
|
Net Cash From (Used For) Financing Activities |
3,792.36 |
-1,380.88 |
-1,886.50 |
|
Net Increase in Cash and Cash Equivalents |
607.86 |
-603.59 |
-1.05 |
|
Cash And Cash Equivalents at The Beginning of The Year |
5.47 |
613.33 |
9.74 |
|
Cash And Cash Equivalents at The End of the Year |
613.33 |
9.74 |
8.69 |
Ratio Analysis
|
|
Mar-21 |
Mar-22 |
Mar-23 |
|
Profitability Ratio |
|
|
|
|
EBITDA Margin |
6.69% |
6.66% |
9.39% |
|
EBIT Margin |
5.73% |
5.80% |
8.79% |
|
Pre-Tax Margin |
4.93% |
5.20% |
8.24% |
|
Net Profit Margin |
3.67% |
3.84% |
6.14% |
|
|
|
|
|
|
Return on Investment |
|
|
|
|
Return on Asset – ROA |
12% |
13% |
25% |
|
Return on Capital Employed – ROCE |
36% |
41% |
63% |
|
Return on Equity – ROE |
26% |
30% |
47% |
|
|
|
|
|
|
Liquidity Ratio (x) |
|
|
|
|
Current ratio |
1.36 |
1.55 |
1.90 |
|
Quick Ratio |
0.99 |
1.09 |
1.52 |
|
|
|
|
|
|
Solvency Ratio |
|
|
|
|
Debt to Equity |
0.05 |
0.04 |
0.01 |
|
Interest Coverage Ratio |
7 |
10 |
16 |
Technical Analysis
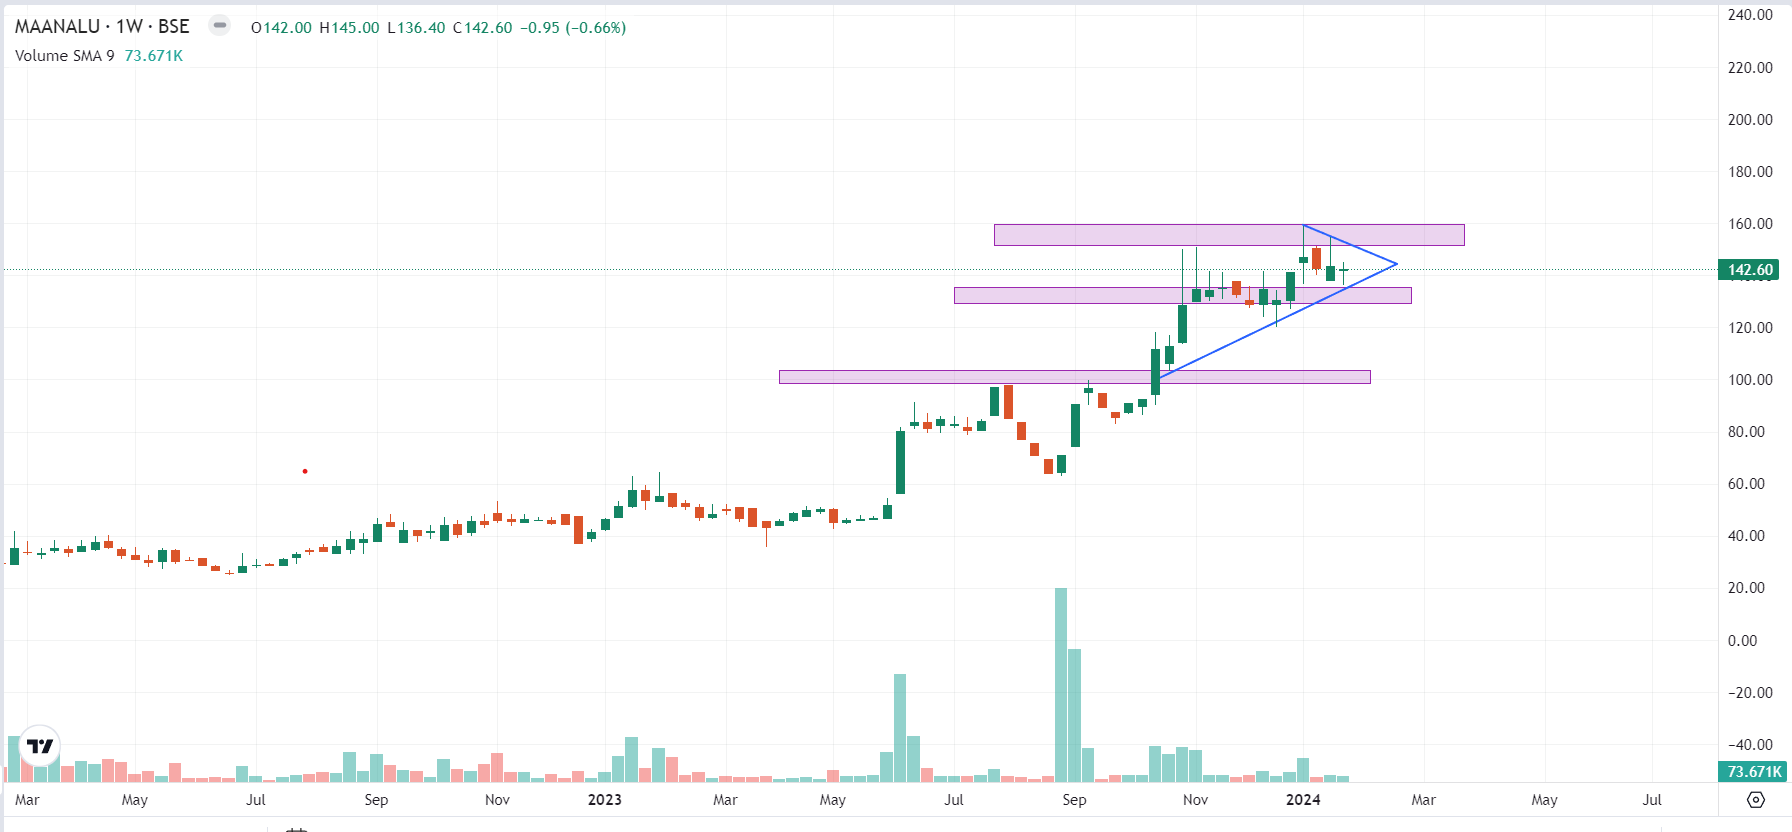
- Current Trend:
- The stock is currently in a robust upward trend, evident from both the monthly and weekly charts. This signals a prevailing positive sentiment among investors, hinting at a potential bullish outlook for the stock.
- Support and Resistance Levels:
- Understanding key support and resistance levels is crucial for predicting potential price movements. For Maan Aluminium Limited, the identified support level stands at ₹135, indicating a historical point of buying interest. On the upside, resistance is noted at ₹151, representing a level where selling pressure may intensify. Having retraced from its all-time high of ₹159, the stock appears well-positioned for accumulation.
- Trend Analysis:
- The stock's trend analysis reveals a formation of higher lows, indicating an ascending trend. This pattern is a positive signal, reflecting the market's inclination to buy at progressively higher price levels. The current consolidation phase suggests the stock is taking a breather, consolidating its gains before potentially resuming its upward trajectory. Investors may find this period opportune for strategic entry points.
Recommendation Rationale
- Fostered strong connections with both dealers and customers:
- The company is spearheaded by Mr. Ravinder Nath Jain, bringing to the table over three decades of extensive experience in the aluminum trading and extrusion industry.
- Leveraging the promoter's wealth of experience, the company has successfully cultivated strong and positive relationships with esteemed customers and reliable suppliers.
- Secured a prominent position in the aluminum extrusion industry:
- Boasting a two-decade operational track record and an aggregate capacity of 12,000 MTPA, Maan Aluminium has firmly positioned itself as a key player in the domestic aluminum extrusion industry.
- The company holds a well-established market presence and is equipped to manufacture a wide range of products applicable across diverse end-user industries. Additionally, MAL serves as the exclusive distributor for Hindalco, handling the trading of aluminum billet/ingot and wire rods in North India and South India
- The company has consistently enhanced its financial performance:
- In FY2023, the company experienced a substantial 42% surge in operating income, reaching Rs. 813.85 crore compared to Rs. 572.29 crore in FY2022. This notable increase can be attributed to a healthy rise in sales realization, coupled with an expansion in export sales volume, which carries high-margin benefits.
- This upward trend is expected to persist in the near future, fueled by higher sales volume due to increased capacities, the introduction of specific value-added products, and a significant improvement in high-margin export orders.
- The company maintains a low level of external debt and exhibits robust coverage indicators, indicating a healthy financial position:
- The company's debt is primarily composed of working capital borrowings, and the debt-to-equity ratio stood at a low of 0.01 times in FY2023, compared to 0.04 times in FY2022.
- Additionally, the debt coverage metrics remained robust, with an interest coverage ratio exceeding 16 times in FY2023. These strong coverage metrics are expected to persist in the future, bolstered by the sustained maintenance of healthy profitability margins and a low level of leverage.
Valuation
- Maan Aluminium Limited has shown revenue growth of 16% CAGR for FY2020-2023.
- The company has shown Net profit growth of 380% of CAGR for FY2020-2023
- The company’s ROCE is 63% and ROE is 47%.
- Financial prospects are expected to enhance in the upcoming years, driven by infrastructure development and a robust order book in the metering segment.
- We anticipate that the company could experience an uptick in revenue, but there might be a potential impact on net profit due to the anticipated rise in raw material prices for the upcoming FY 2024. This estimation is drawn by considering the company's current performance trends observed in FY 2023.
- Anticipating a sustained healthy demand for the product, we expect the net profit to see an increase starting from FY2025.
- To project income for the fiscal years 2024–2028, we used data from the previous four years (2020–2023).
Estimated Income Statement (₹ in lakhs)
|
|
Mar-24 |
Mar-25 |
Mar-26 |
Mar-27 |
Mar-28 |
|
|
2024-E |
2025-E |
2026-E |
2027-E |
2028-E |
|
Revenue |
94,806.72 |
1,09,747.67 |
1,27,045.12 |
1,47,070.92 |
1,70,255.63 |
|
Operating Expenses |
75,542.14 |
86,119.58 |
99,721.34 |
1,15,471.38 |
1,33,708.98 |
|
Employee Expenses |
1,858.03 |
2,151.48 |
2,491.29 |
2,884.77 |
3,340.39 |
|
Other Expenses |
10,007.17 |
11,587.71 |
13,417.88 |
15,537.11 |
17,991.04 |
|
EBITDA |
7,399.38 |
9,888.90 |
11,414.61 |
13,177.67 |
15,215.22 |
|
Depreciation |
547.87 |
620.82 |
706.64 |
807.20 |
924.74 |
|
EBIT |
6,851.51 |
9,268.08 |
10,707.97 |
12,370.47 |
14,290.48 |
|
Financial Cost |
428.01 |
578.97 |
668.92 |
772.77 |
892.71 |
|
EBT before Share of Profit/(Loss) of Joint Venture and Associates |
6,423.50 |
8,689.11 |
10,039.05 |
11,597.70 |
13,397.77 |
|
Share of Profit/(Loss) of Joint Venture and Associates |
- |
- |
- |
- |
- |
|
PBT |
6,423.50 |
8,689.11 |
10,039.05 |
11,597.70 |
13,397.77 |
|
Tax expenses |
1,634.97 |
2,211.63 |
2,555.23 |
2,951.95 |
3,410.12 |
|
PAT |
4,788.53 |
6,477.48 |
7,483.82 |
8,645.75 |
9,987.65 |
- Share :


Post a Comment
|
DISCLAIMER |
This report is only for the information of our customers. Recommendations, opinions, or suggestions are given with the understanding that readers acting on this information assume all risks involved. The information provided herein is not to be construed as an offer to buy or sell securities of any kind. ATS and/or its group companies do not as assume any responsibility or liability resulting from the use of such information.