RAJOO ENGINEERS LIMITED
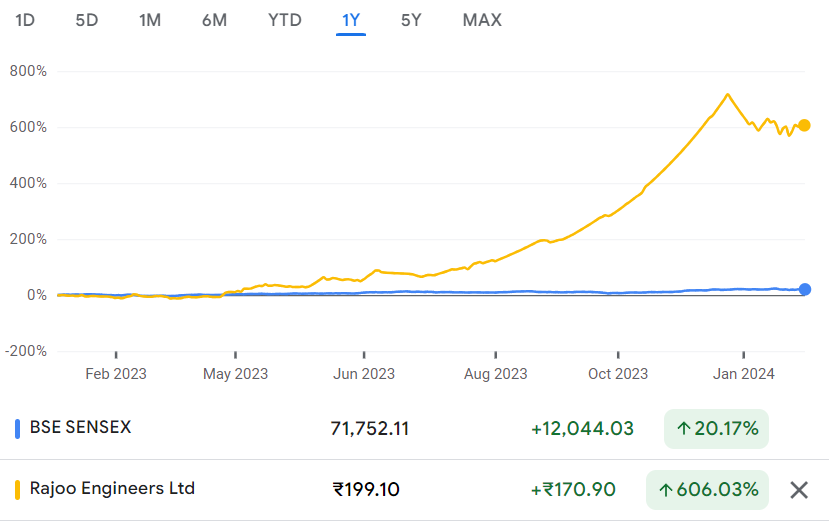
Market Price: ₹199 Recommendation: BUY Target: ₹249 Time Horizon: 1 Year
Q3FY2024 REVIEW
Rajoo Engineers Limited reported net revenue of ₹61.11 crores for the quarter ended December 31, 2023, compared to ₹37.21 crores for December 31, 2022. Profit After Tax was₹6.09 crores for the quarter ended December 31, 2023, against the profit of ₹2.50 crores during the corresponding quarter of the previous year, respectively.
OVERVIEW
- The company has endorsed a buyback plan for up to 9,42,300 fully paid-up equity shares with a face value of Rs. 1/- each. This represents 1.53% of the total equity shares outstanding. The buyback will be executed at a price of Rs. 210/- per equity share, payable in cash. The total aggregate consideration for this buyback is not expected to exceed Rs. 19.78 crores, which includes the amount already incurred or to be incurred by the company.
STOCK DATA
|
52 Week H/L |
234/23.75 |
|
Market Cap (crores) |
1,225 |
|
Face Value (₹) |
1.00 |
|
Book Value |
17.70 |
|
EPS TTM |
1.87 |
|
BSE Code |
522257 |
SHAREHOLDING PATTERN (%)
|
|
Jun-23 |
Sep-23 |
Dec-23 |
|
Promoter |
66.33 |
66.33 |
66.49 |
|
Public |
33.67 |
33.67 |
32.99 |
|
DIIs |
0.00 |
0.00 |
0.00 |
|
FIIs |
0.00 |
0.00 |
0.51 |
BENCHMARK COMPARISON
|
Beta: 0.38 |
Alpha: 586 |
Risk Reward Ratio: 1.41 |
Margin of Safety: 20% |
BUSINESS
-
- Located in Rajkot, Rajoo Engineers Limited has evolved significantly since its modest establishment in 1986 and has emerged as a prominent global player in blown film and sheet extrusion lines. The company has focused its efforts on blown film, sheet extrusion lines, and Thermoformers, securing a premium market position in these segments. As a technology-driven entity, Rajoo Engineers Limited is characterized by product innovations, world-class quality, state-of-the-art workmanship, enhanced energy efficiency, and sophisticated automation.
- Over the years, these qualities have distinguished Rajoo products, positioning them on a global stage and enabling them to compete with established world leaders. With a presence in numerous countries and a customer base spanning over 70 countries, the company's exports have experienced substantial growth since its international debut in 1990. Rajoo Engineers Limited continues to thrive as a key player in the global market for blown film and sheet extrusion lines, maintaining a reputation for technological excellence and quality.
- Rajoo Engineers Limited holds the distinction of being the first company in Asia to establish an R&D Centre specifically for customers. This innovative initiative allows customers to conduct test runs of products, providing a platform for the development and customization of products based on their unique requirements. Furthermore, Rajoo Engineers Limited has introduced an Extrusion Coating and Lamination machine, presenting it as a post-extrusion process.
- Rajoo Engineers Limited has partnered with Bausano & Figli in Italy, MEAF Machines B.V. in the Netherlands, and Wonderpack in Nashik, India. These collaborations aim to enhance the company's technological capabilities, product offerings, and market reach in the field of extrusion and plastic processing.
- The company has recently acquired three industrial plots adjacent to its existing factory in Rajkot. This strategic move is a crucial step in the expansion strategy, as the newly acquired land, located next to the current plant, offers operational synergies. The prime location not only enhances current operations but also opens up possibilities for future development and efficiency improvements. This acquisition positions the company well for continued growth and optimization of its manufacturing capabilities.
- Approximately 60% of the company's annual business is derived from repeat orders, indicating a high level of customer loyalty and satisfaction. Some notable clients contributing to this consistent business include Uflex, Reliance Industries, Indian Oil, Binny Wads, Suvi International, Synthetic Packaging, Abhinav Industries, and S D International
SWOT ANALYSIS
STRENGTH
-
- Innovation R&D Center.
- Global presence.
- Strategic Partnerships.
- Reputed Clientele.
WEAKNESS
-
- Dependence on Key Clients.
- Market Sensitivity.
OPPORTUNITIES
-
- Technological Advancements.
- Diversification.
- Global Expansion.
THREAT
-
- Market Competition.
- Raw Material Prices.
- Regulatory Changes


PLASTICS PROCESSING INDUSTRY ANALYSIS
- The Indian plastics industry is experiencing significant growth due to the vast potential of the local market. Businesses are encouraged to enhance their technical skills, meet high-quality standards, and expand capabilities across various sectors within the plastics industry. Currently, the Indian plastic processing industry encompasses around 30,000 units utilizing techniques such as injection molding, blow molding, extrusion, and calendaring to manufacture a diverse array of products.
- Plastic materials are gaining increasing importance across different industries, leading to a rapid rise in per capita consumption. The versatility, technological advancements, processing equipment, expertise, and cost-effective manufacturing of plastic materials are causing a swift replacement of traditional materials.
- Over the past few decades, the Indian plastics industry has made significant strides, evolving into one of the nation's most crucial sectors with a substantial industrial base. This growth trajectory underscores the industry's vital role in the country's economic landscape and its potential for further expansion and development.
- The Plastics Processing Industry in India is robust and holds the potential to become a significant part of the country's manufacturing economy, similar to industrialized nations such as Germany, Italy, France, the USA, Canada, Japan, China, and Taiwan. Presently, more than 2 lakh core machines are operational, employing processes like Injection Moulding, Extrusion, and Blow Moulding to produce a wide range of products.
- The machinery market within the industry has been growing at a rate of 8.5% over the last four years, indicating a positive trend in expansion. Additionally, the industry has a global presence, with processing machinery being exported to over 50 countries. Machinery building activities remain labor-intensive while being highly technical, reflecting a blend of skilled labor and technical expertise.
- The industry plays a crucial role in providing employment across various skill levels, involving individuals from different strata of society. With over 20 major manufacturers of machinery and nearly 300 small and medium-sized manufacturers, the Plastics Processing Industry in India is characterized by a diverse ecosystem. This diversity contributes to the industry's resilience, adaptability, and potential for sustained growth in the country's manufacturing landscape.
FINANCIAL OVERVIEW
QUARTERLY SUMMARY
|
Quarterly (INR in lakhs) |
Dec-23 |
Sep-23 |
Jun-23 |
Mar-22 |
Dec-22 |
|
Revenue from Operations |
5,999.86 |
5,353.15 |
3,121.01 |
7,143.20 |
3,657.85 |
|
Other income |
111.52 |
91.61 |
122.96 |
56.62 |
63.78 |
|
Total Income |
6,111.38 |
5,444.76 |
3,243.97 |
7,199.82 |
3,721.63 |
|
|
|
|
|
|
|
|
Total Expenditure |
5,326.48 |
4,721.63 |
2,916.35 |
6,584.07 |
3,427.86 |
|
EBIT |
784.90 |
723.13 |
327.62 |
615.75 |
293.77 |
|
|
|
|
|
|
|
|
Finance cost |
17.14 |
14.79 |
8.55 |
14.04 |
7.45 |
|
PBT before Share of Net Profit of Associate |
767.76 |
708.34 |
319.07 |
601.71 |
286.32 |
|
|
|
|
|
|
|
|
Share of Net Profit of Associate |
38.30 |
7.99 |
0.30 |
91.27 |
19.46 |
|
PBT before Exceptional Item |
806.06 |
716.33 |
319.37 |
692.98 |
305.78 |
|
|
|
|
|
|
|
|
Exceptional Item |
- |
- |
- |
- |
- |
|
PBT |
806.06 |
716.33 |
319.37 |
692.98 |
305.78 |
|
|
|
|
|
|
|
|
Tax Expenses |
197.04 |
179.12 |
73.24 |
138.06 |
55.74 |
|
PAT |
609.02 |
537.21 |
246.13 |
554.92 |
250.04 |
PROFIT AND LOSS STATEMENT (₹ in lakhs)
|
|
Mar-21 |
Mar-22 |
Mar-23 |
|
Revenue from Operations |
16,956.84 |
19,032.55 |
17,871.08 |
|
Other Income |
70.99 |
195.46 |
293.32 |
|
Total Income |
17,027.83 |
19,228.01 |
18,164.40 |
|
|
|
|
|
|
Cost of Goods Sold |
10,508.74 |
11,942.38 |
11,184.14 |
|
Employee Benefits Expense |
1,492.87 |
1,766.31 |
1,949.06 |
|
Other Expenses |
2,868.06 |
3,069.84 |
3,148.82 |
|
EBITDA |
2,158.16 |
2,449.48 |
1,882.38 |
|
|
|
|
|
|
Depreciation and Amortisation Expense |
351.08 |
350.41 |
353.62 |
|
EBIT |
1,807.08 |
2,099.07 |
1,528.76 |
|
|
|
|
|
|
Finance Costs |
99.54 |
33.09 |
36.33 |
|
EBT before Share of Profit/(Loss) of Joint Venture and Associates |
1,707.54 |
2,065.98 |
1,492.43 |
|
|
|
|
|
|
Share of Profit/(Loss) of Joint Venture and Associates |
- |
- |
- |
|
EBT before Exceptional Items |
1,707.54 |
2,065.98 |
1,492.43 |
|
|
|
|
|
|
Exceptional Items |
- |
- |
- |
|
EBT |
1,707.54 |
2,065.98 |
1,492.43 |
|
|
|
|
|
|
Tax Expense |
502.11 |
555.60 |
343.56 |
|
PAT Non-Controlling Interests |
1,205.43 |
1,510.38 |
1,148.87 |
|
|
|
|
|
|
Non-Controlling Interests |
- |
- |
- |
|
|
|
|
|
|
PAT |
1,205.43 |
1,510.38 |
1,148.87 |
|
|
|
|
|
|
EPS |
|
|
|
|
Basic |
1.96 |
2.45 |
1.87 |
|
Diluted |
1.96 |
2.45 |
1.87 |
|
|
|
|
|
|
Number of Shares |
|
|
|
|
Basic |
615.31 |
615.31 |
615.31 |
|
Diluted |
615.31 |
615.31 |
615.31 |

Balance Sheet (₹ in lakhs)
|
Mar-21 |
Mar-22 |
Mar-23 |
|
|
ASSETS: |
|
|
|
|
Non-Current Assets: |
|
|
|
|
Property, Plant and Equipment |
3,960.37 |
3,751.27 |
3,554.06 |
|
Capital Work in Progress |
174.55 |
255.15 |
255.93 |
|
Intangible Assets |
165.33 |
136.81 |
110.87 |
|
Intangible Assets Under Development |
- |
- |
- |
|
Financial Assets: |
|
|
|
|
Investments |
3.02 |
8.63 |
14.27 |
|
Loans |
- |
- |
- |
|
Other Non Financial Assets |
52.95 |
35.66 |
36.21 |
|
Other Non-Current Assets |
2.41 |
- |
46.29 |
|
Total Non-Current Assets |
4,358.63 |
4,187.52 |
4,017.63 |
|
|
|
|
|
|
Current Assets: |
|
|
|
|
Inventories |
5,909.73 |
5,694.16 |
6,267.59 |
|
Financial Assets: |
|
|
|
|
Investments |
318.66 |
1,659.59 |
898.85 |
|
Trade Receivables |
1,430.65 |
727.08 |
1,892.85 |
|
Loans |
45.46 |
23.84 |
14.52 |
|
Cash and Cash Equivalents |
450.71 |
1,125.68 |
1,586.50 |
|
Other Bank Balances |
1,537.08 |
1,457.92 |
2,965.62 |
|
Other Financial Assets |
17.03 |
706.21 |
207.65 |
|
Other Current Assets |
1,727.31 |
425.30 |
531.39 |
|
Total Current Assets |
11,436.63 |
11,819.78 |
14,364.97 |
|
|
|
|
|
|
Total Assets |
15,795.26 |
16,007.30 |
18,382.60 |
|
|
|
|
|
|
EQUITY AND LIABILITIES: |
|
|
|
|
Equity: |
|
|
|
|
Equity Share Capital |
615.31 |
615.31 |
615.31 |
|
Other Equity |
7,717.17 |
9,267.44 |
10,275.24 |
|
Equity Attributable to the Owners |
8,332.48 |
9,882.75 |
10,890.55 |
|
|
|
|
|
|
Non-Controlling Interest |
- |
- |
- |
|
Total Equity |
8,332.48 |
9,882.75 |
10,890.55 |
|
|
|
|
|
|
Liabilities: |
|
|
|
|
Non-Current Liabilities: |
|
|
|
|
Financial Liabilities |
|
|
|
|
Borrowings |
71.96 |
- |
- |
|
Deposits |
- |
- |
- |
|
Other Financial Liabilities |
- |
13.11 |
55.31 |
|
Provisions |
- |
- |
- |
|
Deferred Tax Liabilities |
420.99 |
377.58 |
383.31 |
|
Other Non-Current Liabilities |
- |
- |
- |
|
Total Non-Current Liabilities |
492.95 |
390.69 |
438.62 |
|
|
|
|
|
|
Current Liabilities: |
|
|
|
|
Financial Liabilities: |
|
|
|
|
Borrowings |
237.25 |
27.96 |
152.21 |
|
Trade Payables: |
|
|
|
|
Total outstanding dues of micro enterprises and small enterprises |
524.83 |
447.17 |
359.09 |
|
Other Creditors |
1,991.84 |
1,781.70 |
1,714.80 |
|
Other Financial Liabilities |
34.83 |
148.67 |
156.59 |
|
Provisions |
303.81 |
349.42 |
363.84 |
|
Current Tax Liabilities |
471.11 |
232.48 |
43.00 |
|
Other Current Liabilities |
3,406.16 |
2,746.46 |
4,263.90 |
|
Total Current Liabilities |
6,969.83 |
5,733.86 |
7,053.43 |
|
|
|
|
|
|
Total Equity & Liabilities |
15,795.26 |
16,007.30 |
18,382.60 |
Cash Flow Statement (₹ lakhs)
|
|
Mar-21 |
Mar-22 |
Mar-23 |
|
Net Profit Before Tax |
1,987.37 |
2,974.98 |
6,703.28 |
|
Net Cash from Operating Activities |
-1,949.19 |
1,509.70 |
2,902.36 |
|
Net Cash Used for Investing Activities |
-1,235.31 |
-732.41 |
-1,016.91 |
|
Net Cash From (Used For) Financing Activities |
3,792.36 |
-1,380.88 |
-1,886.50 |
|
Net Increase in Cash and Cash Equivalents |
607.86 |
-603.59 |
-1.05 |
|
Cash And Cash Equivalents at The Beginning of The Year |
5.47 |
613.33 |
9.74 |
|
Cash And Cash Equivalents at The End of the Year |
613.33 |
9.74 |
8.69 |
Ratio Analysis
|
Mar-21 |
Mar-22 |
Mar-23 |
|
|
Profitability Ratio |
|
|
|
|
EBITDA Margin |
12.73% |
12.87% |
10.53% |
|
EBIT Margin |
10.66% |
11.03% |
8.55% |
|
Pre-Tax Margin |
10.07% |
10.85% |
8.35% |
|
Net Profit Margin |
7.11% |
7.94% |
6.43% |
|
|
|
|
|
|
Return on Investment |
|
|
|
|
Return on Asset – ROA |
8% |
9% |
7% |
|
Return on Capital Employed – ROCE |
19% |
22% |
14% |
|
Return on Equity – ROE |
16% |
17% |
11% |
|
|
|
|
|
|
Liquidity Ratio (x) |
|
|
|
|
Current ratio |
1.64 |
2.06 |
2.04 |
|
Quick Ratio |
0.79 |
1.07 |
1.15 |
|
|
|
|
|
|
Solvency Ratio |
|
|
|
|
Debt to Equity |
0.00 |
0.00 |
0.01 |
|
Interest Coverage Ratio |
18 |
63 |
42 |
Technical Analysis
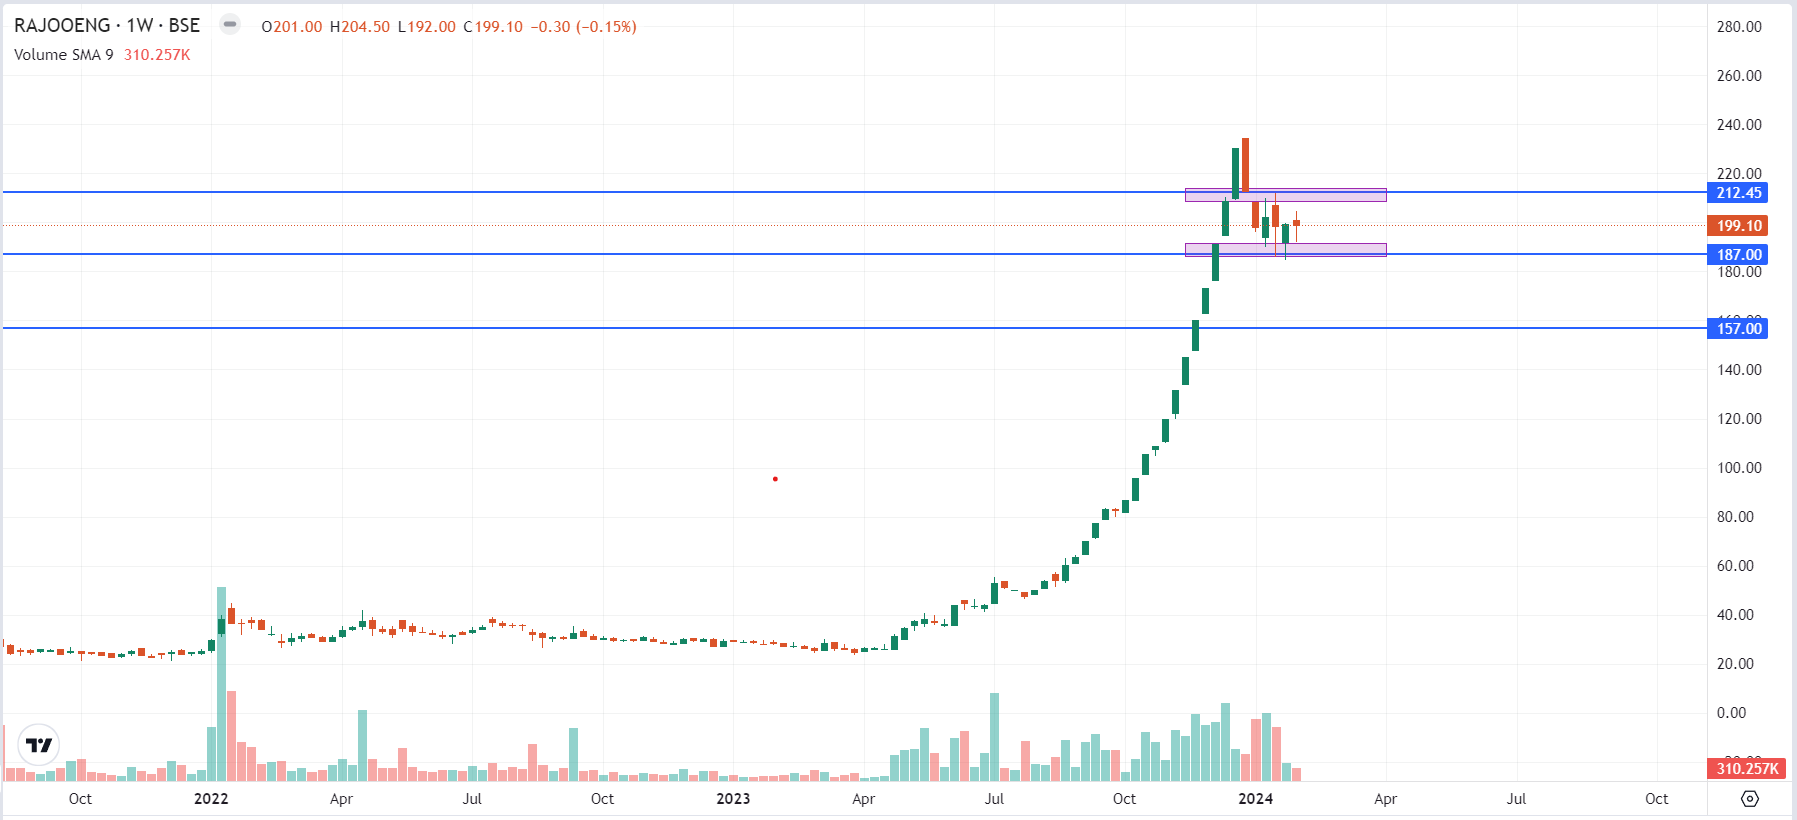
- Current Trend:
- The stock is currently in a robust upward trend, evident from both the monthly and weekly charts. This signals a prevailing positive sentiment among investors, hinting at a potential bullish outlook for the stock.
- Support and Resistance Levels:
- Understanding key support and resistance levels is crucial for predicting potential price movements. For Rajoo Engineers Limited, the identified support level stands at ₹187, indicating a historical point of buying interest. On the upside, resistance is noted at ₹230, representing a level where selling pressure may intensify. Having retraced from its all- time high of ₹234, the stock appears well-positioned for accumulation.
- Trend Analysis:
- The stock's trend analysis reveals a formation of higher lows, indicating an ascending trend. This pattern is a positive signal, reflecting the market's inclination to buy at progressively higher price levels. The current consolidation phase suggests the stock is taking a breather, consolidating its gains before potentially resuming its upward trajectory. Investors may find this period opportune for strategic entry points.
Concall (Q2FY2023)
- Rajoo Engineers has taken strategic steps to enhance its production capacity by acquiring three industrial plots, aligning with the increasing market demand. The company's innovative approach is evident in the launch of Lamina E, India's first mono and multilayer EVA/POE sheet extrusion system designed for producing encapsulant sheets for solar cells.
- With a focus on capturing a substantial market share in agriculture and renewable energy sectors, Rajoo Engineers is targeting export growth in Latin America and Europe.
- The company's expansion plans extend to the Middle East and Europe through an enlarged sales network. The financial performance in Q2 FY24 indicates positive trends, with a year-on-year increase in revenue, EBITDA margin, and profit after tax.
- H1 FY24 has seen a significant YoY increase in revenue from operations by 63.44%. Rajoo Engineers anticipates maintaining similar margins in the upcoming quarters.
- Rajoo Engineers is strategically positioned for growth by emphasizing global expansion, market diversification, and investments in research and development and quality control.
- Key growth strategies include prioritizing customer experience, continuous innovation through R&D efforts, and a specific focus on the agriculture and renewable energy sectors.
- The company's operational efficiency is reflected in machinery delivery times ranging from 3 to 10 months, with payment received before dispatch in 95% of cases.
- Rajoo Engineers adopts a prudent approach to managing foreign exchange risk by hedging exports for 3 to 4 months while keeping imports open. Overall, the company demonstrates a commitment to sustained growth, innovation, and global market leadership in the plastics processing industry.
Recommendation Rationale
- The company possesses a well-established history of operations:
- Established in 1986 as a manufacturer of plastic extrusion machines, REL boasts a robust operational history spanning more than three and a half decades within the industry. This extensive track record has solidified its presence and cultivated strong relationships with both customers and suppliers. Offering a broad product portfolio, including monolayer machines, multi-layer machines, lamination lines, vacuum forming, and sheet manufacturing machines, among others, REL has diversified its offerings.
- Widely diversified global presence:
- Notably, REL's revenue profile demonstrates geographical diversification, with export sales constituting approximately 40% of its Total Operating Income (TOI) in the past five years until FY23. The company exports its products to over 40 countries, with a primary focus on Africa, the Gulf, and the South Asian Association for Regional Cooperation (SAARC) region.
- In the realm of export sales, REL typically favors transactions involving advance payments or letters of credit. Furthermore, REL maintains a diversified customer base, with the top 10 customers contributing around 36% of its Total Operating Income in FY23 (a figure slightly lower than the 34% recorded in FY22). Given its position in the capital goods industry, the company's top customer base is subject to change based on the capital expenditure plans of its clients.
- Secured a prominent position in the aluminum extrusion industry:
- Boasting a two-decade operational track record and an aggregate capacity of 12,000 MTPA, Maan Aluminium has firmly positioned itself as a key player in the domestic aluminum extrusion industry.
- The company holds a well-established market presence and is equipped to manufacture a wide range of products applicable across diverse end-user industries. Additionally, MAL serves as the exclusive distributor for Hindalco, handling the trading of aluminum billet/ingot and wire rods in North India and South India
- The company maintains a strong solvency position:
- REL maintains a strong solvency position by minimizing reliance on debt. As of March 31, 2023, the company is debt-free, having negligible outstanding debt. The PBILDT interest coverage ratio is 42 times. Additionally, REL has acquired two adjoining plots for an expansion project, with an estimated capex of Rs. 14-15 crore, entirely funded through company liquidity.
Valuation
- Rajoo Engineers Limited has shown revenue growth of 21.81% CAGR for FY2020-2023.
- The company has shown Net profit growth of 96% of CAGR for FY2020-2023
- The company’s ROCE is 14% and ROE is 11%.
- To project income for the fiscal years 2024–2028, we used data from the previous four years (2020–2023).
Estimated Income Statement (₹ in lakhs)
|
|
Mar-24 |
Mar-25 |
Mar-26 |
Mar-27 |
Mar-28 |
|
|
2024-E |
2025-E |
2026-E |
2027-E |
2028-E |
|
Revenue |
22,090.81 |
26,869.97 |
32,687.49 |
39,769.43 |
48,391.08 |
|
Operating Expenses |
13,640.96 |
16,604.66 |
20,225.58 |
24,636.09 |
30,008.38 |
|
Employee Expenses |
2,197.14 |
2,676.26 |
3,259.86 |
3,970.72 |
4,836.60 |
|
Other Expenses |
3,673.27 |
4,474.29 |
5,449.98 |
6,638.44 |
8,086.05 |
|
EBITDA |
2,579.44 |
3,114.76 |
3,752.08 |
4,524.18 |
5,460.05 |
|
Depreciation |
333.42 |
319.91 |
311.34 |
308.09 |
310.65 |
|
EBIT |
2,246.02 |
2,794.85 |
3,440.73 |
4,216.09 |
5,149.40 |
|
Financial Cost |
53.38 |
66.42 |
81.77 |
100.19 |
122.37 |
|
EBT before Share of Profit/(Loss) of Joint Venture and Associates |
2,192.64 |
2,728.43 |
3,358.97 |
4,115.90 |
5,027.03 |
|
Share of Profit/(Loss) of Joint Venture and Associates |
- |
- |
- |
- |
- |
|
PBT |
2,192.64 |
2,728.43 |
3,358.97 |
4,115.90 |
5,027.03 |
|
Tax expenses |
504.75 |
628.09 |
773.24 |
947.49 |
1,157.23 |
|
PAT |
1,687.89 |
2,100.34 |
2,585.73 |
3,168.41 |
3,869.80 |
- Share :


Post a Comment
|
DISCLAIMER |
This report is only for the information of our customers. Recommendations, opinions, or suggestions are given with the understanding that readers acting on this information assume all risks involved. The information provided herein is not to be construed as an offer to buy or sell securities of any kind. ATS and/or its group companies do not as assume any responsibility or liability resulting from the use of such information.