ION EXCHANGE (INDIA) LIMITED
Market Price: ₹513 Recommendation: BUY Target: ₹650 Time Horizon: 1 Year
Q4FY2023 REVIEW
ION Exchange (India) Limited reported net revenue of ₹1,989.61 crores for the quarter ended March 31, 2023, compared to ₹1,576.87 crores for March 31, 2022.
Profit After Tax was ₹194.96 crores for the quarter ended March 31, 2023, compared to ₹161.69 crores during the corresponding quarter of the previous year, respectively.
OVERVIEW
- On April 20, 2023, the company put forward a proposition to invest in and take over MAPRIL - Produtos Químicos e Maquinas Para a Industrial, Lda, a target company. The proposal included the acquisition of 11,11,500 equity shares, which constituted 100% of the issued and paid-up equity capital of MAPRIL. The Share Sale and Purchase Agreement has been executed, and as of June 22, 2023, the share transfer process has been successfully completed.
- A stock split was announced by the company in a ratio of 1:10. The record date for determining the eligibility of shareholders was set on June 12.
BENCHMARK COMPARISON
Beta: 1.11 |
Alpha: 90 |
Risk Reward Ratio: 1.45 |
Margin of Safety: 20% |
STOCK DATA
|
52 Week H/L |
519/1.01 |
|
Market Cap (crores) |
7,532 |
|
Face Value (₹) |
1.00 |
|
Book Value |
56.98 |
|
EPS TTM |
16.59 |
|
NSE Code |
IONEXCHANG |
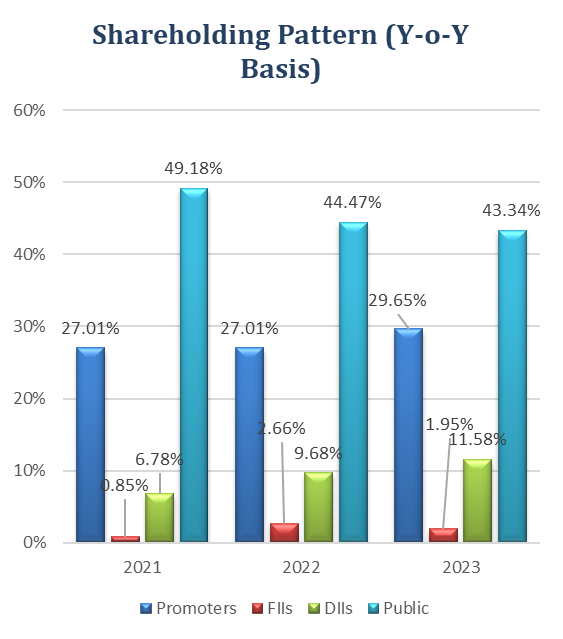
SHAREHOLDING PATTERN (%)
|
|
Sep-22 |
Dec-22 |
Mar-23 |
|
Promoter |
27.01 |
26.99 |
26.95 |
|
Public |
45.28 |
44.58 |
43.34 |
|
FIIs |
0.71 |
0.77 |
1.95 |
|
DIIs |
10.82 |
11.48 |
11.58 |
BUSINESS
- ION Exchange (India) Limited is a prominent Indian company engaged in the business of water and environment management solutions. Founded in 1964, it is headquartered in Mumbai, India. The company specializes in providing water and wastewater treatment solutions, offering a wide range of products, services, and technologies.
- ION Exchange focuses on addressing the challenges related to water scarcity and pollution by providing innovative and sustainable solutions. It caters to various industries such as power, chemicals, pharmaceuticals, food and beverages, and municipal corporations, among others.
- The company's product portfolio includes water treatment plants, wastewater treatment plants, process chemicals, membrane filtration systems, and ion exchange resins. They also provide services such as plant operations and maintenance, consultancy, and technical support.
- It has a global presence apart from presence in major cities in India with 36+ sales & service centers and 100+ Channel Partners. It exports to Africa, Japan, Middle East, Russia, Southeast Asia, Europe, UK, USA, Canada, and neighboring countries. It has a track record of executing large-scale projects and has gained recognition for its expertise and reliability in the industry.
- The company has two facilities for in-house R&D and two applications and testing centers. It has over 50 patents to its credit and 100+ products commercialized.
- Business & FY2023 Revenue Mix (%):
- Engineering (60%) – Provides comprehensive and integrated services and solutions in water & wastewater treatment including Sea Water desalination, Recycle, and Zero liquid discharge plants to diverse industries.
- Chemicals (30%) – Provides a comprehensive range of resins, speciality chemicals, and customized chemical treatment programmes for water, non-water, and specialty applications.
- Consumer Products (10%) – Caters to individuals, hotels, spas, educational institutions, hospitals, laboratories, railways, and defense establishments providing safe drinking water and a clean environment.
SWOT ANALYSIS
STRENGTH
- Strong market presence.
- Diversified product portfolio.
- Track record of execution.
WEAKNESS
- Dependency on economic condition.
- High research and development costs.
OPPORTUNITIES
- Increasing demand for water and environment management.
- Government initiatives and regulations.
THREAT
- Intense competition.
- Susceptibility to economic cycles
WASTEWATER TREATMENT INDUSTRY ANALYSIS
- The India Water and Wastewater Treatment Technologies Market is expected to witness substantial growth, with a projected compound annual growth rate (CAGR) of 10.78% during the forecast period from 2023 to 2028. This growth would result in the market size expanding from USD 923.46 million in 2023 to USD 1,540.73 million by 2028.
- In an economic climate where weak demand has dampened private-sector investment, public capital expenditure (capex) can serve as a catalyst for recovery. Extensive studies conducted by Crisil indicate that government capex has a higher multiplier effect on the economy compared to revenue expenditure. Recognizing this, the Government of India (GoI) is actively implementing various funding and regulatory mechanisms to encourage private investments in the water and wastewater treatment market. This initiative opens up promising opportunities for the industry.
- Additionally, the GoI has launched several robust initiatives such as the Atal Mission for Rejuvenation and Urban Transformation, National Mission for Clean Ganga, Jal Jeevan Mission, and Community Drinking Water Schemes. These initiatives are expected to significantly contribute to the growth of the Indian water and wastewater treatment industry.
- the combination of rapid industrialization, a growing population, urbanization, and stricter enforcement of environmental regulations will drive increased demand for wastewater treatment and recycling plants in all sectors, including industries, institutions, homes, and communities.
- The World Bank has emphasized the significance of implementing effective water management strategies for India's Gross Domestic Product (GDP) growth on an annual basis. Corporates are increasingly recognizing the importance and benefits of integrating water sustainability into their strategies and allocating resources for wastewater treatment, recycling, and zero liquid discharge.
- There is also a global trend of customers showing a preference for integrated water and environment management solutions. Revenue generation in this sector relies on exporting engineering products, customized EPC (Engineering, Procurement, and Construction) projects, resins, water treatment chemicals, membranes, and services.
FINANCIAL OVERVIEW
QUARTERLY SUMMARY
|
Quarterly (INR in lakhs) |
Mar-23 |
Dec-22 |
Sep-22 |
Jun-22 |
Mar-22 |
|
Revenue from Operations |
64,748.00 |
51,212.00 |
44,761.00 |
38,240.00 |
49,636.00 |
|
Other income |
549.00 |
1,257.00 |
813.00 |
1,488.00 |
2,118.00 |
|
Total Income |
65,297.00 |
52,469.00 |
45,574.00 |
39,728.00 |
51,754.00 |
|
|
|
|
|
|
|
|
Total Expenditure |
54,847.00 |
45,717.00 |
40,153.00 |
35,654.00 |
40,842.00 |
|
EBIT |
10,450.00 |
6,752.00 |
5,421.00 |
4,074.00 |
10,912.00 |
|
|
|
|
|
|
|
|
Finance cost |
231.00 |
235.00 |
230.00 |
224.00 |
245.00 |
|
PBT Before Profit/(Loss) of Equity Accounted Investee |
10,219.00 |
6,517.00 |
5,191.00 |
3,850.00 |
10,667.00 |
|
|
|
|
|
|
|
|
Profit/(Loss) of Equity Accounted Investee |
12.00 |
24.00 |
12.00 |
45.00 |
-19.00 |
|
PBT |
10,231.00 |
6,541.00 |
5,203.00 |
3,895.00 |
10,648.00 |
|
|
|
|
|
|
|
|
Tax Expenses |
2,112.00 |
1,772.00 |
1,333.00 |
1,157.00 |
2,328.00 |
|
PAT |
8,119.00 |
4,769.00 |
3,870.00 |
2,738.00 |
8,320.00 |
PROFIT AND LOSS STATEMENT (₹ in lakhs)
|
|
Mar-21 |
Mar-22 |
Mar-23 |
|
Revenue from Operations |
1,44,951.95 |
1,57,687.00 |
1,98,961.00 |
|
Other Income |
3,308.80 |
4,170.00 |
4,107.00 |
|
Total Income |
1,48,260.75 |
1,61,857.00 |
2,03,068.00 |
|
|
|
|
|
|
Cost of Goods sold |
89,189.92 |
94,574.00 |
1,24,257.00 |
|
Gross Profit |
59,070.83 |
67,283.00 |
78,811.00 |
|
|
|
|
|
|
Excise Duty |
- |
- |
- |
|
Employee Benefits Expense |
17,362.88 |
19,904.00 |
23,627.00 |
|
Other Expenses |
18,169.08 |
21,889.00 |
25,578.00 |
|
EBITDA |
23,538.87 |
25,490.00 |
29,606.00 |
|
|
|
|
|
|
Depreciation and Amortisation Expense |
2,767.47 |
2,804.00 |
2,909.00 |
|
EBIT |
20,771.40 |
22,686.00 |
26,697.00 |
|
|
|
|
|
|
Finance Costs |
1,260.82 |
995.00 |
920.00 |
|
EBT before Share of Profit/(Loss) of Joint Venture and Associates |
19,510.58 |
21,691.00 |
25,777.00 |
|
|
|
|
|
|
Share of Profit/(Loss) of Joint Venture and Associates |
-6.99 |
42.00 |
93.00 |
|
EBT before Exceptional Items |
19,503.59 |
21,733.00 |
25,870.00 |
|
|
|
|
|
|
Exceptional Items |
- |
- |
- |
|
EBT |
19,503.59 |
21,733.00 |
25,870.00 |
|
|
|
|
|
|
Tax Expense |
5,171.19 |
5,564.00 |
6,374.00 |
|
PAT Non-Controlling Interests |
14,332.40 |
16,169.00 |
19,496.00 |
|
|
|
|
|
|
Non-Controlling Interests |
60.92 |
108.69 |
178.00 |
|
PAT |
14,393.32 |
16,277.69 |
19,674.00 |
|
|
|
|
|
|
EPS |
|
|
|
|
Basic |
12.14 |
13.73 |
16.60 |
|
Diluted |
12.14 |
13.73 |
16.60 |
|
|
|
|
|
|
Number of Shares |
|
|
|
|
Basic |
1,185.52 |
1,185.52 |
1,185.52 |
|
Diluted |
1,185.52 |
1,185.52 |
1,185.52 |
Balance Sheet (₹ in lakhs)
|
|
Mar-21 |
Mar-22 |
Mar-23 |
|
ASSETS |
|
|
|
|
Non-Current Assets: |
|
|
|
|
Property, Plant and Equipment |
14,864.36 |
14,460.00 |
17,071.00 |
|
Capital-Work-Progress |
1,459.82 |
2,004.00 |
4,195.00 |
|
Goodwill |
863.10 |
192.00 |
178.00 |
|
Other Non-Current Assets |
60.53 |
1,706.00 |
1,544.00 |
|
Total Non-Current Assets |
25,033.06 |
27,854.00 |
31,224.00 |
|
|
|
|
|
|
Current Assets: |
|
|
|
|
Inventories |
12,759.46 |
18,096.00 |
22,226.00 |
|
Financial Assets: |
|
|
|
|
Trade Receivables |
44,896.02 |
32.00 |
32.00 |
|
Cash and Cash Equivalents |
19,722.73 |
50,770.00 |
69,679.00 |
|
Other Bank Balances |
30,815.20 |
16,908.00 |
17,536.00 |
|
Other Current Assets |
8,417.71 |
31.00 |
4.00 |
|
Total Current Assets |
1,19,297.77 |
1,34,687.00 |
1,62,791.00 |
|
|
|
|
|
|
Total Assets |
1,44,330.83 |
1,62,541.00 |
1,94,015.00 |
|
|
|
|
|
|
EQUITY AND LIABILITIES: |
|
|
|
|
Equity: |
|
|
|
|
Equity Share Capital |
1,422.88 |
1,423.00 |
1,423.00 |
|
Other Equity |
49,161.06 |
64,143.00 |
81,926.00 |
|
Total Equity |
50,571.49 |
65,483.00 |
83,580.00 |
|
|
|
|
|
|
Liabilities: |
|
|
|
|
Non-Current Liabilities: |
|
|
|
|
Financial Liabilities |
|
|
|
|
Borrowings |
795.01 |
1,172.00 |
1,568.00 |
|
Lease Liabilities |
483.88 |
290.00 |
341.00 |
|
Provisions |
1,704.73 |
1,898.00 |
2,389.00 |
|
Total Non-Current Liabilities |
3,882.29 |
4,326.00 |
5,299.00 |
|
|
|
|
|
|
Current Liabilities: |
|
|
|
|
Financial Liabilities: |
|
|
|
|
Borrowings |
4,343.35 |
3,636.00 |
3,681.00 |
|
Lease Liabilities |
610.34 |
424.00 |
333.00 |
|
Trade Payables: |
|
|
|
|
Total Outstanding Dues of Micro and Small Enterprises |
1,504.76 |
3,036.00 |
6,087.00 |
|
Other Creditors |
52,026.95 |
49,313.00 |
49,038.00 |
|
Other Current Liabilities |
25,184.26 |
30,849.00 |
40,707.00 |
|
Provisions |
524.98 |
734.00 |
663.00 |
|
Current Tax Liabilities |
2,576.28 |
1,501.00 |
592.00 |
|
Total Current Liabilities |
89,877.05 |
92,732.00 |
1,05,136.00 |
|
|
|
|
|
|
Total Equity & Liabilities |
1,44,330.83 |
1,62,541.00 |
1,94,015.00 |
Cash Flow Statement (₹ in lakhs)
|
|
Mar-21 |
Mar-22 |
Mar-23 |
|
Net Profit Before Tax |
19,510.58 |
21,691.00 |
25,777.00 |
|
Net Cash from Operating Activities |
19,705.49 |
9,138.00 |
6,273.00 |
|
Net Cash Used for Investing Activities |
-2,923.57 |
-9,200.00 |
-4,041.00 |
|
Net Cash From (Used For) Financing Activities |
-7,470.44 |
-2,686.00 |
-1,531.00 |
|
Net Increase in Cash and Cash Equivalents |
9,311.48 |
-2,748.00 |
701.00 |
|
Cash And Cash Equivalents at The Beginning of The Year |
10,145.66 |
19,722.83 |
16,907.86 |
|
Cash And Cash Equivalents at The End of the Year |
19,722.83 |
16,907.86 |
17,535.86 |
Ratio Analysis
|
|
Mar-21 |
Mar-22 |
Mar-23 |
|
Profitability Ratio |
|
|
|
|
Gross Profit |
40.75% |
42.67% |
39.61% |
|
EBITDA Margin |
16.24% |
16.16% |
14.88% |
|
EBIT Margin |
14.33% |
14.39% |
13.42% |
|
Pre-Tax Margin |
13.46% |
13.78% |
13.00% |
|
Net Profit Margin |
9.93% |
10.32% |
9.89% |
|
|
|
|
|
|
Return on Investment |
|
|
|
|
Return on Asset – ROA |
10% |
11% |
11% |
|
Return on Capital Employed – ROCE |
43% |
37% |
34% |
|
Return on Equity – ROE |
33% |
28% |
26% |
|
|
|
|
|
|
Liquidity Ratio (x) |
|
|
|
|
Current ratio |
1.33 |
1.45 |
1.55 |
|
Quick Ratio |
1.19 |
1.26 |
1.34 |
|
|
|
|
|
|
Solvency Ratio |
|
|
|
|
Debt to Equity |
0.02 |
0.02 |
0.02 |
|
Interest Coverage Ratio |
16 |
23 |
29 |
Technical Analysis
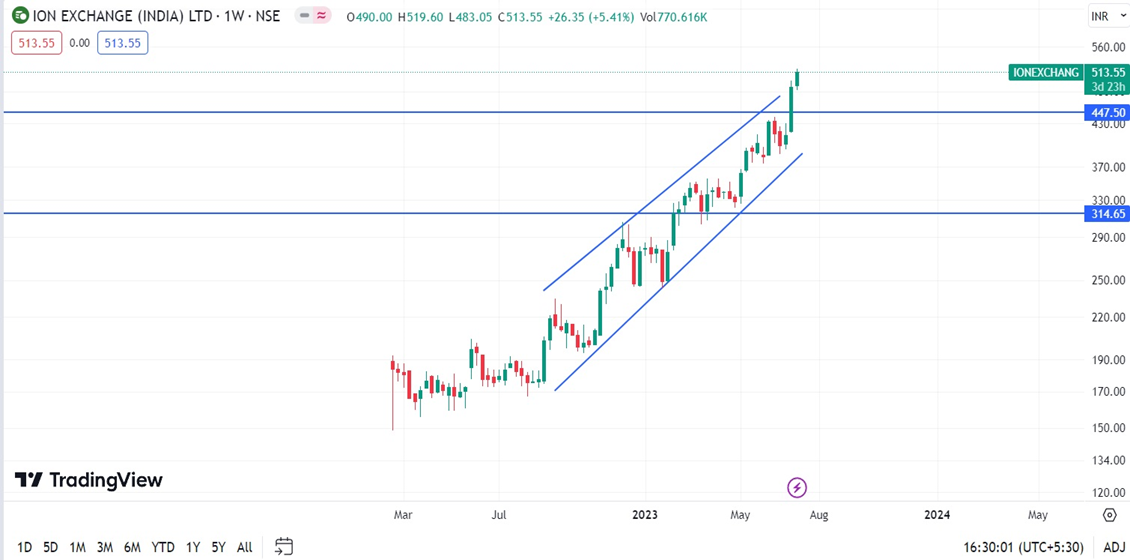
- Stock is in an upward trend on the monthly and weekly chart, ₹314 and ₹447 are support and resistance zone levels.
- It has given a good breakout around ₹447 level.
- One can accumulate this stock at current levels.
CONCALL (Q4FY2023)
- In Q4 FY23, the operating income of the company reached ₹6475 million, showing a YoY increase of approximately 30% and a QoQ increase of about 26%. The EBITDA reported during the same period was ₹1064 million, reflecting a YoY increase of around 12% and a QoQ increase of approximately 70%. For the full financial year 2023, on a consolidated basis, the operating income amounted to ₹ 19,896 million, indicating a YoY increase of around 26%. The EBITDA for the year stood at ₹2550 million, representing a YoY increase of approximately 20%. The EBITDA margin reported was 12.82%.
- During the quarter, the Engineering division experienced notable revenue growth. The Chemicals division reported a revenue of ₹1640 million, showing a YoY increase of approximately 8.25%. Additionally, the Consumer division segment reported a revenue of ₹515 million, reflecting a YoY increase of around 21%.
- The company has allocated expenditure towards developing infrastructure and enhancing capabilities for its engineering business. Substantial investments have been made to strengthen the company's project execution capabilities.
- Looking ahead, the company has formulated a capital expenditure plan of over 500 crores for the next two years. Specifically, the Roha project is anticipated to require investments of approximately 400 crores, while the resin project is estimated to cost around 400 crores as well.
- The company aims to normalize its working capital cycle in the fiscal year 2023-2024. It anticipates substantial growth in the engineering business and reasonable growth in the chemical segment in the current year. Additionally, the company expects significant growth in the top line and reasonable growth in EBITDA margins in fiscal year 2024, with the engineering division acting as the primary driver.
- Regarding the chemical segment, the company expects margins to meet those achieved in the fiscal year 2022-2023 if certain factors such as commodity prices, supply chain stability, exchange rates, and geopolitical situation in Europe remain stable. Looking ahead, the company anticipates an improvement in bottom-line performance or margin percentages in the future, provided that the aforementioned factors remain stable.
- The bid pipeline of the company comprises a favorable combination of industrial projects and projects from Public Sector Undertakings (PSUs). However, the number of municipal or infrastructure projects in the bid pipeline is relatively lower. The company expects to maintain or exceed the level of order inflow compared to previous years, reflecting confidence in securing new projects. Approximately 65% of the current order book consists of industrial orders, emphasizing the significance of industrial projects in the company's portfolio.
Recommendation Rationale
- Strong foothold in the water treatment business:
- The Ion Exchange group possesses extensive expertise in delivering a comprehensive portfolio of products within the water treatment segment. The promoters' longstanding presence and a strong nationwide aftersales service have played a significant role in establishing the brand's reputation.
- Moreover, the group has a diverse customer base that spans across various industries. Notable clients include JSW Steel Ltd, Steel Authority of India Ltd, L&T Ltd, IRCTC, and the TATA Group. Additionally, the group serves players in other sectors such as automotive, food and beverages, paper, pharmaceuticals, chemicals, and cement. This broad reach demonstrates the group's ability to cater to a wide range of industries and underscores its position as a trusted provider within the market.
- Healthy Order Book and Diversified Revenue Stream:
- The company maintains a well-diversified revenue stream, with the engineering, chemicals, and consumer products divisions contributing 60%, 30%, and 10% respectively to sales in fiscal year 2023. This balanced distribution of revenue across divisions helps mitigate risks and enhances stability for the company.
- As of March 31st, 2023, the company has an approximate order book of ₹2,219 crores, excluding the Sri Lanka project, UP SWSM, and Delhi Jal Nigam order. The outstanding amount for the Sri Lanka project is ₹246 crores, while the UP SWSM and Delhi Jal Nigam orders amount to ₹965 crores. These projects contribute to the company's overall order book and future revenue potential.
- Strong Financial Risk Profile:
- As of March 31, 2023, the company's net worth stands at ₹856 crore, compared to ₹655 crore the previous year. This indicates a growth in the company's financial strength and stability. The company demonstrates strong debt protection metrics, with a debt-to-equity ratio of 0.02 times and an interest coverage ratio of 29 times in fiscal year 2023. These metrics highlight the company's ability to comfortably manage its debt obligations and interest payments.
- In fiscal year 2024, the company anticipates significant growth in the top line and reasonable growth in EBITDA margins. The engineering division is expected to be the primary driver of this growth, reflecting its importance in driving the company's financial performance.
Valuation
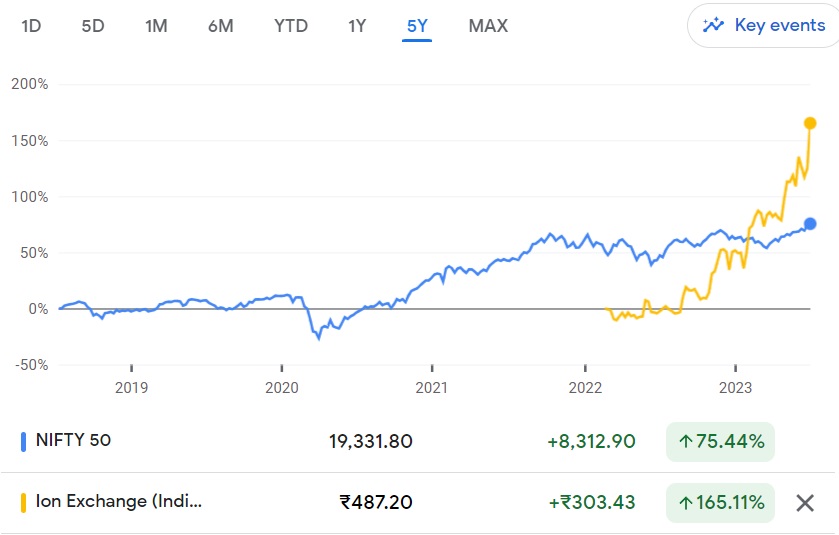
- ION Exchange (India) Limited has shown revenue growth of 14% CAGR for FY2019-2023.
- Net Profit has shown a growth rate of 31% CAGR for FY2019-2023.
- The company’s ROE and ROCE are 26% & 34% for FY2023.
- We estimate the company could generate higher revenue and net profit for the following FY 2024, comparable to the prior year, based on the company's present performance in FY 2023.
- To project income for the fiscal years 2024–2028, we used data from the previous five years (2019–2023).
Estimated Income Statement (₹ in lakhs)
|
Particulars |
Mar-24 |
Mar-25 |
Mar-26 |
Mar-27 |
Mar-28 |
|
|
2024-E |
2025-E |
2026-E |
2027-E |
2028-E |
|
Revenue |
2,32,096.50 |
2,65,282.34 |
3,03,221.70 |
3,46,596.33 |
3,96,185.84 |
|
COGS |
1,42,129.66 |
1,62,573.05 |
1,85,956.94 |
2,12,704.28 |
2,43,298.85 |
|
Gross Profit |
89,966.84 |
1,02,709.29 |
1,17,264.76 |
1,33,892.05 |
1,52,886.99 |
|
Employee Expenses |
27,875.75 |
31,885.29 |
36,471.55 |
41,717.48 |
47,717.96 |
|
Other Expenses |
30,423.96 |
34,800.03 |
39,805.54 |
45,531.01 |
52,080.02 |
|
EBITDA |
31,667.13 |
36,023.97 |
40,987.68 |
46,643.56 |
53,089.01 |
|
Depreciation |
3,505.78 |
4,155.73 |
4,874.45 |
5,676.03 |
6,575.88 |
|
EBIT |
28,161.35 |
31,868.24 |
36,113.23 |
40,967.53 |
46,513.13 |
|
Financial Cost |
970.46 |
1,098.21 |
1,244.49 |
1,411.77 |
1,602.88 |
|
PBT Before Profit/(Loss) of Equity Accounted Investee |
27,190.89 |
30,770.04 |
34,868.74 |
39,555.76 |
44,910.25 |
|
Profit/(Loss) of Equity Accounted Investee |
98.10 |
111.01 |
125.80 |
142.71 |
162.03 |
|
PBT |
27,288.99 |
30,881.05 |
34,994.54 |
39,698.47 |
45,072.28 |
|
Tax expenses |
6,723.62 |
7,608.65 |
8,622.16 |
9,781.14 |
11,105.17 |
|
PAT |
20,467.27 |
23,161.39 |
26,246.58 |
29,774.62 |
33,805.08 |
- Share :


Post a Comment
|
DISCLAIMER |
This report is only for the information of our customers. Recommendations, opinions, or suggestions are given with the understanding that readers acting on this information assume all risks involved. The information provided herein is not to be construed as an offer to buy or sell securities of any kind. ATS and/or its group companies do not as assume any responsibility or liability resulting from the use of such information.