DP WIRES LIMITED REPORT RESEARCH
D P Wires Limited reported net revenue of ₹386.64 crores for the quarter ended March 31, 2023, compared to ₹178.33 crores for March 31, 2022. Profit After Tax was ₹15.06 crores for the quarter ended March 31, 2023, compared to ₹6.98 crores during the corresponding quarter of the previous year, respectively.
OVERVIEW
- Sales volumes for steel wires reached their highest-ever levels in Q4FY23 with 26,179 MT (up 47% Y-o-Y & 20% Q-o-Q) and FY23 with 85,943 MT (up 28% Y-o-Y). Strong credit rating with LT and ST ratings of CRISIL A2+ and A2-/Stable, respectively.
- At the current plant at Ratlam, the steel wires' capacity was increased by 4,000 MT to 84,000 MT. Developed exports in Bangladesh and exported the first batch of LRPC to markets in the USA and Brazil.
BENCHMARK COMPARISON
Beta: 0.66 |
Alpha: 72.15 |
Risk Reward Ratio: 1.86 |
Margin of Safety: 31% |
STOCK DATA
|
52 Week H/L |
264/507 |
|
Market Cap (crores) |
698 |
|
Face Value (₹) |
10.00 |
|
Book Value |
141.12 |
|
EPS TTM |
30.23 |
|
NSE Code |
DPWIRES |
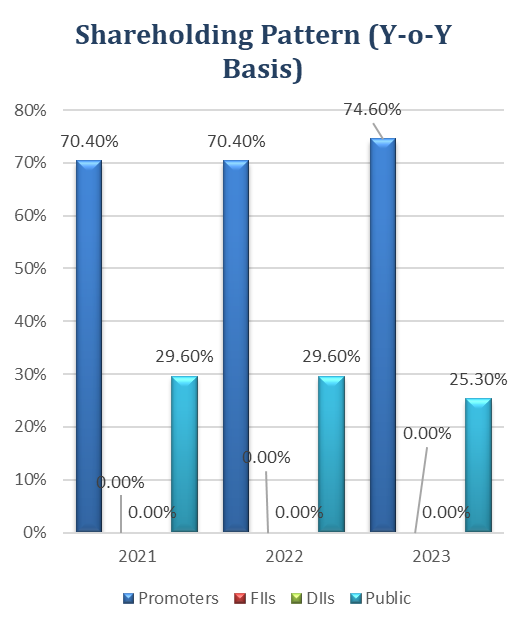
SHAREHOLDING PATTERN (%)
|
|
Sep-22 |
Dec-22 |
Mar-23 |
|
Promoter |
74.43 |
74.43 |
74.43 |
|
Public |
23.79 |
23.93 |
23.88 |
|
FIIs |
1.78 |
1.63 |
1.70 |
|
DIIs |
0.01 |
0.00 |
0.00 |
BUSINESS
- DP Wires Limited is an Indian company that specializes in the manufacturing and distribution of wires and cables. Founded in 1979, the company has established itself as a prominent player in the electrical industry and has a diverse product portfolio catering to various sectors.
- Here is a brief overview of each of the company's products:
- Steel wires: DP Wires manufactures a variety of steel wires, including high-tensile wires, low-carbon wires, and stainless-steel wires. These wires are used in a variety of applications, including construction, automotive, and electrical.
- LRPC strands: LRPC strands are a type of high-strength steel strand that is used in the construction of bridges and other infrastructure. DP Wires is one of the leading manufacturers of LRPC strands in India.
- Induction tempered wire: Induction tempered wire is a type of steel wire that is heat-treated to improve its strength and toughness. This type of wire is used in a variety of applications, including the manufacturing of springs, cables, and reinforcement bars.
- Geomembrane sheets: Geomembrane sheets are used to create watertight barriers. DP Wires manufactures a variety of geomembrane sheets, including HDPE geomembranes, LDPE geomembranes, and LLDPE geomembranes. These sheets are used in a variety of applications, including landfill liner systems, dam construction, and agricultural applications.
- DP Wires exports its products to over 20 countries. This global reach gives the company access to a large and growing market.
- The company serves a clientele of more than 100 customers across a variety of end-user industries, such as oil and power, automotive, construction, infrastructure, etc. They provide services to well-known clients including Simplex Infrastructures, L&T, APCO, Gannon Dunkerley, and Hindalco, among others.
- The company's production facility, with an installed capacity of 80,000 tonnes per year, is in Ratlam, Madhya Pradesh. The company also has two 0.80 MW wind farms in the District of Jamnagar.
- Revenue segment:
- Wire Division: 47% in FY2023 vs 84% in FY2022.
- Plastic Division: 0.56% in FY2023 vs 1.56% in FY2022.
- Trading Division: 51.9% in FY2023 vs 14.33% in FY2022.
SWOT ANALYSIS
STRENGTH
- Well-equipped manufacturing facility.
- Experienced management team.
- Strong focus on quality.
- Good financial position.
WEAKNESS
- Dependency on raw material.
- Competition from international players.
- High cost of production.
OPPORTUNITIES
- Expanding in raw material.
- Investing in research and development.
- Developing new products.
THREAT
- Fluctuation in raw material prices.
- Economic in government regulations.
STEEL INDUSTRY ANALYSIS
- According to the World Steel Association (World Steel), India's crude steel production increased by 4.1% to 11.2 MT in May 2023, despite a 5.1% decline in worldwide output to 161.6 MT.
- China continued to lead the world in crude steel output in May with 90.1 MT, despite a 7.3 percent year-over-year (y-o-y) decline. In May 2023, India produced 11.2 MT of crude steel, an increase of 4.1%. At 7.6 MT, Japan's production was likewise 5.2% lower year over year. 6.9 MT of steel were manufactured in the United States, a 2.3% yearly decline.
- Despite awarding some new development projects, the government's capital push helped to preserve the capacity utilisation rate for the steel sector at a prediction of 80% in FY2023.
- Given that it is predicted that the Central Government's capital expenditures (capex) would increase by 37% YoY in FY2024.
- Steel consumption growth for FY2024 has been revised and increased by Rating Agencies to 7-8%.
- The National Infrastructure Pipeline (NIP) launch, which has a positive outlook and anticipates infrastructure investment of 111 lakh crore between FY20–25, is the primary sign of the country's push for infrastructure projects.
- The NIP presently has more than 8,500 projects in various phases of development with an estimated investment of more than 100 lakh crore.
- The infrastructure, housing, and building sectors have received a much-needed boost thanks to the budget for FY 23–24, which is supported at the policy level by the government.
- To improve regional aviation connectivity under the "Udan" initiative, the budget for FY23–24 additionally prioritises the revival of 50 more airports, heliports, water aerodromes, and advanced landing groundings.
- Following the elimination of export taxes, monthly shipments of finished steel more than quadrupled to over 0.6 MT in Q4 FY23 from lows of 0.3 MT in November 2022.
- Although this improvement is heartening to witness, the development prospects in the international markets in the short future appear to be more difficult.
FINANCIAL OVERVIEW
QUARTERLY SUMMARY
|
Quarterly (INR in lakhs) |
Mar-23 |
Dec-22 |
Sep-22 |
Jun-22 |
Mar-22 |
|
Revenue from Operations |
38,664.14 |
34,428.99 |
28,396.29 |
20,041.95 |
17,833.15 |
|
Other income |
256.41 |
176.78 |
111.06 |
55.34 |
126.45 |
|
Total Income |
38,920.55 |
34,605.77 |
28,507.35 |
20,097.29 |
17,959.60 |
|
|
|
|
|
|
|
|
Total Expenditure |
36,783.74 |
33,310.55 |
27,274.95 |
19,027.86 |
16,972.92 |
|
EBIT |
2,136.81 |
1,295.22 |
1,232.40 |
1,069.43 |
986.68 |
|
|
|
|
|
|
|
|
Finance cost |
60.99 |
56.46 |
27.65 |
56.18 |
44.17 |
|
PBT Before Exceptional Items |
2,075.82 |
1,238.76 |
1,204.75 |
1,013.25 |
942.51 |
|
|
|
|
|
|
|
|
Exceptional Items |
- |
- |
- |
- |
- |
|
PBT |
2,075.82 |
1,238.76 |
1,204.75 |
1,013.25 |
942.51 |
|
|
|
|
|
|
|
|
Tax Expenses |
569.34 |
307.92 |
301.77 |
252.12 |
243.68 |
|
PAT |
1,506.48 |
930.84 |
902.98 |
761.13 |
698.83 |
PROFIT AND LOSS STATEMENT (₹ in lakhs)
|
|
Mar-21 |
Mar-22 |
Mar-23 |
|
Revenue from Operations |
46,672.22 |
61,323.70 |
1,21,531.37 |
|
Other Income |
252.57 |
273.60 |
599.58 |
|
Total Income |
46,924.79 |
61,597.30 |
1,22,130.95 |
|
|
|
|
|
|
Cost of Goods sold |
37,845.52 |
50,459.55 |
1,08,398.14 |
|
Gross Profit |
9,079.27 |
11,137.75 |
13,732.81 |
|
|
|
|
|
|
Excise Duty |
- |
- |
- |
|
Employee Benefits Expense |
530.12 |
754.31 |
782.84 |
|
Other Expenses |
4,976.15 |
6,043.23 |
6,869.38 |
|
EBITDA |
3,573.00 |
4,340.21 |
6,080.59 |
|
|
|
|
|
|
Depreciation and Amortisation Expense |
222.45 |
247.04 |
346.73 |
|
EBIT |
3,350.55 |
4,093.17 |
5,733.86 |
|
|
|
|
|
|
Finance Costs |
109.67 |
212.51 |
201.29 |
|
EBT before Share of Profit/(Loss) of Joint Venture and Associates |
3,240.88 |
3,880.66 |
5,532.57 |
|
|
|
|
|
|
Share of Profit/(Loss) of Joint Venture and Associates |
- |
- |
- |
|
EBT before Exceptional Items |
3,240.88 |
3,880.66 |
5,532.57 |
|
|
|
|
|
|
Exceptional Items |
- |
- |
- |
|
EBT |
3,240.88 |
3,880.66 |
5,532.57 |
|
|
|
|
|
|
Tax Expense |
833.11 |
975.34 |
1,431.15 |
|
PAT Non-Controlling Interests |
2,407.77 |
2,905.32 |
4,101.42 |
|
|
|
|
|
|
Non-Controlling Interests |
- |
- |
- |
|
PAT |
2,407.77 |
2,905.32 |
4,101.42 |
|
|
|
|
|
|
EPS |
|
|
|
|
Basic |
17.75 |
21.41 |
30.23 |
|
Diluted |
17.75 |
21.41 |
30.23 |
|
|
|
|
|
|
Number of Shares |
|
|
|
|
Basic |
135.68 |
135.68 |
135.68 |
|
Diluted |
135.68 |
135.68 |
135.68 |
Balance Sheet (₹ in lakhs)
|
|
Mar-21 |
Mar-22 |
Mar-23 |
|
ASSETS: |
|
|
|
|
Non-Current Assets: |
|
|
|
|
Property, Plant and Equipment |
1,119.26 |
1,616.25 |
1,985.20 |
|
Right-to-Use Assets |
24.65 |
26.88 |
26.38 |
|
Investment Property |
1,148.95 |
1,154.47 |
1,129.33 |
|
Other Non-Current Assets |
298.74 |
17.26 |
15.49 |
|
Total Non-Current Assets |
2,601.37 |
2,974.45 |
3,413.60 |
|
|
|
|
|
|
Current Assets: |
|
|
|
|
Inventories |
2,535.47 |
4,710.04 |
4,964.98 |
|
Financial Assets: |
|
|
|
|
Trade Receivables |
6,239.15 |
8,780.90 |
8,699.36 |
|
Cash and Cash Equivalents |
351.96 |
613.67 |
3,084.85 |
|
Other Bank Balances |
175.47 |
214.97 |
242.13 |
|
Other Current Assets |
2,743.06 |
1,899.13 |
4,741.56 |
|
Total Current Assets |
12,768.77 |
16,628.38 |
21,732.88 |
|
|
|
|
|
|
Total Assets |
15,370.14 |
19,602.83 |
25,146.48 |
|
|
|
|
|
|
EQUITY AND LIABILITIES: |
|
|
|
|
Equity: |
|
|
|
|
Equity Share Capital |
1,356.80 |
1,356.80 |
1,356.80 |
|
Other Equity |
10,909.49 |
13,821.84 |
17,790.38 |
|
Total Equity |
12,266.29 |
15,178.64 |
19,147.18 |
|
|
|
|
|
|
Liabilities: |
|
|
|
|
Non-Current Liabilities: |
|
|
|
|
Financial Liabilities |
|
|
|
|
Borrowings |
283.87 |
210.54 |
74.56 |
|
Lease Liabilities |
25.57 |
28.08 |
27.95 |
|
Provisions |
54.64 |
40.80 |
5.94 |
|
Total Non-Current Liabilities |
364.08 |
279.42 |
108.45 |
|
|
|
|
|
|
Current Liabilities: |
|
|
|
|
Financial Liabilities: |
|
|
|
|
Borrowings |
486.68 |
1,079.40 |
111.94 |
|
Lease Liabilities |
0.01 |
0.12 |
0.12 |
|
Trade Payables: |
|
|
|
|
Total Outstanding Dues of Micro and Small Enterprises |
11.27 |
18.30 |
2.50 |
|
Other Creditors |
403.74 |
873.70 |
2,206.22 |
|
Other Current Liabilities |
1,614.49 |
1,982.67 |
3,135.17 |
|
Provisions |
223.58 |
191.11 |
247.48 |
|
Current Tax Liabilities |
- |
-0.53 |
187.42 |
|
Total Current Liabilities |
2,739.77 |
4,144.77 |
5,890.85 |
|
|
|
|
|
|
Total Equity & Liabilities |
15,370.14 |
19,602.83 |
25,146.48 |
Cash Flow Statement (₹ in lakhs)
|
|
Mar-21 |
Mar-22 |
Mar-23 |
|
Net Profit Before Tax |
3,240.87 |
3,880.65 |
5,532.57 |
|
Net Cash from Operating Activities |
-1,218.05 |
448.35 |
4,554.33 |
|
Net Cash Used for Investing Activities |
1,163.62 |
-479.57 |
-607.77 |
|
Net Cash From (Used For) Financing Activities |
365.87 |
292.92 |
-1,475.38 |
|
Net Increase in Cash and Cash Equivalents |
311.44 |
261.70 |
2,471.18 |
|
Cash And Cash Equivalents at The Beginning of The Year |
40.52 |
351.96 |
613.66 |
|
Cash And Cash Equivalents at The End of the Year |
351.96 |
613.66 |
3,084.84 |
Ratio Analysis
|
|
Mar-21 |
Mar-22 |
Mar-23 |
|
Profitability Ratio |
|
|
|
|
Gross Profit |
19.45% |
18.16% |
11.30% |
|
EBITDA Margin |
7.66% |
7.08% |
5.00% |
|
EBIT Margin |
7.18% |
6.67% |
4.72% |
|
Pre-Tax Margin |
6.94% |
6.33% |
4.55% |
|
Net Profit Margin |
5.16% |
4.74% |
3.37% |
|
|
|
|
|
|
Return on Investment |
|
|
|
|
Return on Asset – ROA |
17% |
17% |
18% |
|
Return on Capital Employed – ROCE |
29% |
29% |
33% |
|
Return on Equity – ROE |
22% |
21% |
24% |
|
|
|
|
|
|
Liquidity Ratio (x) |
|
|
|
|
Current ratio |
4.66 |
4.01 |
3.69 |
|
Quick Ratio |
3.74 |
2.88 |
2.85 |
|
|
|
|
|
|
Solvency Ratio |
|
|
|
|
Debt to Equity |
0.02 |
0.01 |
0.00 |
|
Interest Coverage Ratio |
31 |
19 |
28 |
Technical Analysis
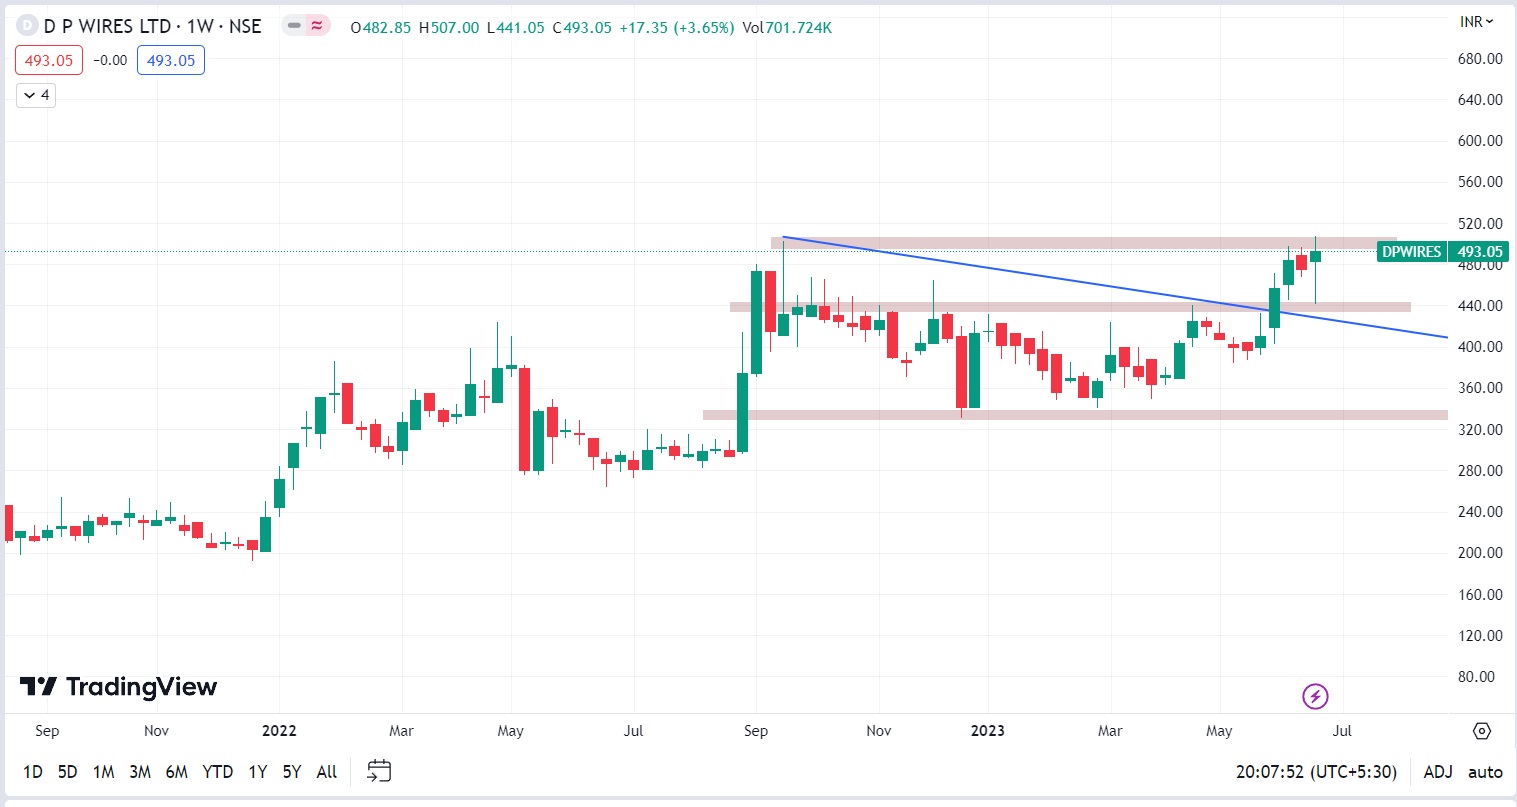
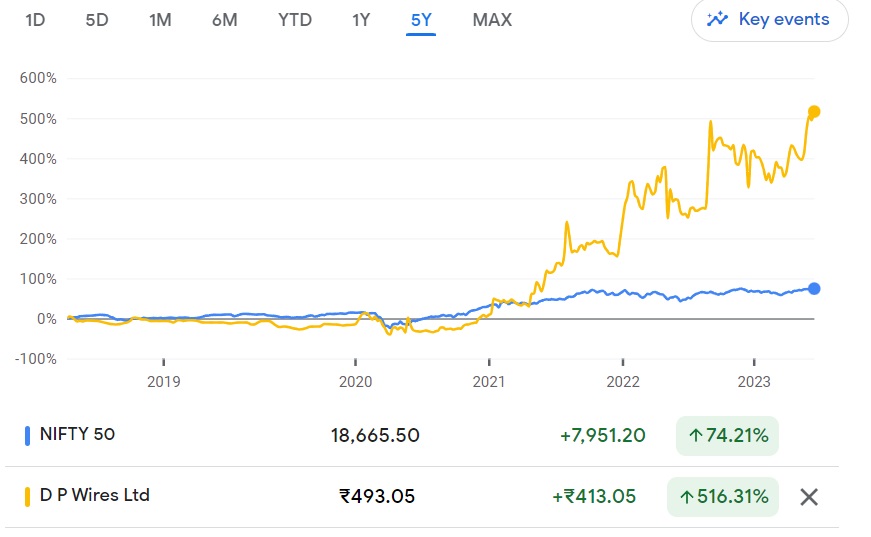
- Stock is in upward trend on monthly and weekly charts, ₹350 and ₹506 are support and resistance levels.
- The stock has given a good breakout around ₹440 levels.
- One can accumulate this stock at current levels.
Recommendation Rationale
- Promoters' comprehensive business knowledge, and solid market position:
- Promoters' considerable expertise in the plastic and steel industries spanning more than 20 years, which has allowed them to forge strong relationships with clients and suppliers and have a solid grasp of market dynamics, supports the business risk profile.
- For the wire segment, DPWL has a history of working with both customers and suppliers. It serves 150 to 200 clients in the construction, infrastructure, automotive (2- and 4-wheeler), oil, and power industries, among other diverse end-user industries.
- It can overcome the danger of a downturn in a certain sector and achieve better growth because of its diverse end-user industry base. In addition, LRPC/stranded wire is a specialised product with a small market share. An established market position has also come about as a result of this. The moderate scale of DPWL gives it operational flexibility in a highly competitive sector.
- The promoters have recently entered the trade of HDPE (High-Density Polyethylene) granules, which should continue to support DPWL's market position over the medium term, along with consistent revenue growth in the wire sector.
- Low demand for working capital:
- According to GCA (gross current assets) days of 70–90 as of March 2023, which are primarily driven by modest receivables and inventory days, DPWL has a moderate working capital cycle.
- The working capital cycle has continued to be supported by enough bank lines, both fund-based and non-fund-based, and low creditor days, which have stayed between 5 and 10 as of March 2023.
- Healthy financial risk profile:
- As of March 31, 2023, the firm had a good net worth of Rs 191.47 crore, thanks to excellent revenue growth and favourable operating profitability. As of March 31, 2023, DPWL relied less on external loans, which resulted in a reduced debt level and a solid capital structure.
- The capital structure and metrics for debt protection should remain solid over the medium term, with net cash accruals expected to reach above Rs. 30.84 Cr in FY2023.
Valuation
- D P Wires Limited has shown revenue growth of 38.36% CAGR for FY2019-2023.
- Net Profit has shown a growth rate of 24% CAGR for FY2019-2023.
- The company’s ROE and ROCE are 24% & 33% for FY2023.
- We estimate the company could generate higher revenue and net profit for the following FY 2024, comparable to the prior year, based on the company's present performance in FY 2023.
- To project income for the fiscal years 2024–2028, we used data from the previous five years (2019–2023).
Estimated Income Statement (₹ in lakhs)
|
|
Mar-24 |
Mar-25 |
Mar-26 |
Mar-27 |
Mar-28 |
|
|
2024-E |
2025-E |
2026-E |
2027-E |
2028-E |
|
Revenue |
1,68,810.40 |
2,33,379.11 |
3,22,697.70 |
4,46,258.37 |
6,17,194.35 |
|
COGS |
1,44,170.43 |
1,99,474.28 |
2,75,992.71 |
3,81,863.65 |
5,28,346.73 |
|
Gross Profit |
24,639.97 |
33,904.83 |
46,704.99 |
64,394.73 |
88,847.62 |
|
Employee Expenses |
1,575.74 |
2,180.19 |
3,016.51 |
4,173.65 |
5,774.66 |
|
Other Expenses |
13,037.57 |
18,038.79 |
24,958.48 |
34,532.56 |
47,779.27 |
|
EBITDA |
10,026.67 |
13,685.86 |
18,730.01 |
25,688.52 |
35,293.69 |
|
Depreciation |
432.53 |
562.78 |
749.21 |
1,012.29 |
1,380.53 |
|
EBIT |
9,594.14 |
13,123.08 |
17,980.80 |
24,676.23 |
33,913.16 |
|
Financial Cost |
336.81 |
460.69 |
631.22 |
866.27 |
1,190.54 |
|
EBT |
9,257.33 |
12,662.39 |
17,349.57 |
23,809.96 |
32,722.62 |
|
Tax expenses |
2,394.66 |
3,275.47 |
4,487.94 |
6,159.09 |
8,464.60 |
|
PAT |
6,862.67 |
9,386.91 |
12,861.63 |
17,650.86 |
24,258.02 |
Nayan Nahar Shubham Titvilasi
Equity Research Analyst Equity Research Analyst
Ph: 8149629086 Ph: 7415440968
Email: nayannahar23@gmail.com Email: shubham.titvilasi@gmail.com
Disclaimer: This report is only for the information of our customer Recommendations, opinions, or suggestions are given with the understanding that readers acting on this information assume all risks involved. The information provided herein is not to be construed as an offer to buy or sell securities of any kind.
- Share :


Post a Comment
|
DISCLAIMER |
This report is only for the information of our customers. Recommendations, opinions, or suggestions are given with the understanding that readers acting on this information assume all risks involved. The information provided herein is not to be construed as an offer to buy or sell securities of any kind. ATS and/or its group companies do not as assume any responsibility or liability resulting from the use of such information.