Elgi Equipments Ltd.
|
Current price |
140.65 |
|
Sector |
Compressors |
|
No of shares |
158454508 |
|
52 week high |
174.80 |
|
52 week low |
93.95 |
|
BSE Sensex |
27457.58 |
|
Nifty |
8342.15 |
|
Average Volume |
54,748 |
|
BSE Code |
522074 |
|
NSE Symbol |
ELGIEQUIP |
Elgi Equipments Limited - Company Overview
Elgi Equipments Limited is a leading air compressor manufacturer with a broad line of innovative and technologically superior compressed air systems. Elgi Equipments Limited has earned worldwide distinction for designing sustainable solutions that help companies achieve their productivity goals and keep the cost of ownership low. Elgi Equipments Limited offers a complete range of compressed air solutions from oil-lubricated and oil-free rotary screw compressors, oil-lubricated and oil-free reciprocating compressors and centrifugal compressors, to dryers, filters and downstream accessories. ELGI has received ISO 9001:2000 certification for its quality management.
Companies subsidiary includes Adisons Precision Instruments Manufacturing Company Limited, ATS Elgi Limited, Elgi-Gulf (FZE), Elgi Equipments (Zhejiang) Limited (China), Elgi Compressors Trading (Shanghai) Co. Ltd. (China), SAS Belair (France), Elgi Compressores DO BRASIL IMP. E.EXP. Ltda, Elgi Australia Pty Ltd., Elgi Compressors Italy S.r.l., Elgi Compressors USA Inc, Rotair Spa (Italy), Patton's Inc (USA), Patton's Medical LLC. (USA) and PT Elgi Equipments Indonesia.
The products range includes Rotary Screw Air Compressors, Reciprocating Air Compressors , Automotive Equipments , Railway Compressor and OE and ELGI New Generation Compressors.
The company’s portfolio of over 400 products has found wide application across industries. Whether it is the paint on your wall, the car you drive, the medicines you take or the leather bag you carry, Elgi products have been used either in their production, maintenance or usage. ELGI has a presence in all the major markets across the world covering Europe, North America, Latin America, Africa, Australia, Middle East, South East Asia, West Asia and the Far East. The current market capitalization stands at Rs 2,242.13 crore.
Elgi Equipments Limited - Share Holding Pattern
|
Category |
No. of Shares |
Percentage |
|
Promoters |
50,548,420 |
31.90 |
|
General Public |
49,048,772 |
30.95 |
|
Foreign Institutions |
22,103,094 |
13.95 |
|
NBFC and Mutual Funds |
17,994,860 |
11.36 |
|
Other Companies |
17,298,618 |
10.92 |
|
Others |
801,998 |
0.51 |
|
Foreign - NRI |
486,488 |
0.31 |
|
Financial Institutions |
172,258 |
0.11 |
Elgi Equipments Limited - Financial Details
-
Market Cap (Rs Cr) – 2218.36
-
Company P/E (x) – 34.40
-
Industry P/E (x) – 31.85
-
Book Value (Rs) – 31.31
-
Price / BV (x) – 4.47
-
Dividend (%) – 100%
-
EPS (TTM) – 4.07
-
Dividend Yield (%) – 0.71%
-
Face Value (Rs) – 1
Industry Overview
The industrial compressors industry in India, currently valued at INR 33bn (~USD 550mn) in FY 2014, has been growing at a CAGR of ~7% for the last three years. Value Notes estimates that the industry will be worth approximately INR 50bn (~USD 833 million) by FY 2019, growing at CAGR of ~9%
Though screw compressors have captured 50% of the overall industrial compressors market (by value) in India, centrifugal compressors are currently in a state of growth with 30% of the market (by value). In the future, centrifugal compressors will have a ~38% share of the overall industrial compressors market (by value).
Growth in the automobile, steel, power, oil & gas and cement industries are generating demand for industrial compressors. Emerging industries like geothermal and waste heat will boost the demand for industrial compressors. The report includes profiles of the top 5 players with a brief overview about their service offerings, key financial ratios, expansion strategies, etc.
Industrial compressors industry is used to create a high pressure for functioning heavy machines in industries such as cement, steel, oil & gas, petroleum, textile, etc. Industrial compressors can be classified into reciprocation, centrifugal and screw compressors. Screw compressors are highest selling compressors in India followed by centrifugal compressors. Centrifugal compressors are slowly replacing screw compressors because of their higher energy efficiency, high level of compression and noise free operations.
Many expansion projects, which are in the pipeline in the oil & gas, cement and steel industries, will be executed in the next 4-5 years and this will generate overall demand for industrial compressors in India.
Balance Sheet
|
|
Mar '14 |
Mar '13 |
Mar '12 |
Mar '11 |
Mar '10 |
|
Sources Of Funds |
|
|
|
|
|
|
Total Share Capital |
15.85 |
15.85 |
15.85 |
15.85 |
7.82 |
|
Equity Share Capital |
15.85 |
15.85 |
15.85 |
15.85 |
7.82 |
|
Reserves |
480.20 |
420.47 |
367.75 |
310.14 |
250.31 |
|
Networth |
496.05 |
436.32 |
383.60 |
325.99 |
258.21 |
|
Secured Loans |
92.37 |
19.83 |
0.00 |
0.00 |
0.00 |
|
Total Debt |
92.37 |
19.83 |
0.00 |
0.00 |
0.10 |
|
Total Liabilities |
588.42 |
456.15 |
383.60 |
325.99 |
258.31 |
|
Application Of Funds |
|
|
|
|
|
|
Gross Block |
306.55 |
224.74 |
209.20 |
184.66 |
164.05 |
|
Less: Accum. Depreciation |
149.63 |
130.85 |
117.84 |
113.99 |
99.62 |
|
Net Block |
156.92 |
93.89 |
91.36 |
70.67 |
64.43 |
|
Capital Work in Progress |
84.80 |
74.92 |
7.38 |
3.41 |
2.18 |
|
Investments |
86.89 |
85.09 |
65.08 |
47.35 |
46.76 |
|
Inventories |
105.19 |
99.30 |
92.69 |
87.51 |
59.24 |
|
Sundry Debtors |
178.41 |
149.50 |
108.63 |
87.44 |
71.16 |
|
Cash and Bank Balance |
21.91 |
23.64 |
109.39 |
8.66 |
8.98 |
|
Total Current Assets |
305.51 |
272.44 |
310.71 |
183.61 |
139.38 |
|
Loans and Advances |
161.47 |
124.60 |
94.00 |
184.95 |
129.85 |
|
Fixed Deposits |
0.00 |
0.00 |
0.00 |
109.02 |
93.16 |
|
Total CA, Loans & Advances |
466.98 |
397.04 |
404.71 |
477.58 |
362.39 |
|
Current Liabilities |
160.06 |
136.62 |
114.61 |
116.83 |
114.93 |
|
Provisions |
47.12 |
58.16 |
70.32 |
156.20 |
104.00 |
|
Total CL & Provisions |
207.18 |
194.78 |
184.93 |
273.03 |
218.93 |
|
Net Current Assets |
259.80 |
202.26 |
219.78 |
204.55 |
143.46 |
|
Miscellaneous Expenses |
0.00 |
0.00 |
0.00 |
0.00 |
1.46 |
|
Total Assets |
588.41 |
456.16 |
383.60 |
325.98 |
258.29 |
|
Contingent Liabilities |
199.91 |
133.45 |
113.67 |
23.50 |
1.17 |
|
Book Value (Rs) |
31.31 |
27.54 |
24.21 |
20.57 |
33.03 |
Profit and Loss Account
|
|
Mar '14 |
Mar '13 |
Mar '12 |
Mar '11 |
Mar '10 |
|
Income |
|
|
|
|
|
|
Sales Turnover |
828.33 |
816.54 |
794.78 |
828.71 |
615.43 |
|
Excise Duty |
0.00 |
0.00 |
0.00 |
55.61 |
35.01 |
|
Net Sales |
828.33 |
816.54 |
794.78 |
773.10 |
580.42 |
|
Other Income |
5.77 |
12.99 |
11.99 |
5.13 |
-30.73 |
|
Stock Adjustments |
3.10 |
-1.56 |
12.81 |
1.85 |
3.30 |
|
Total Income |
837.20 |
827.97 |
819.58 |
780.08 |
552.99 |
|
Expenditure |
|
|
|
|
|
|
Raw Materials |
504.09 |
494.19 |
506.52 |
490.96 |
370.76 |
|
Power & Fuel Cost |
9.81 |
7.84 |
7.30 |
6.75 |
4.76 |
|
Employee Cost |
90.85 |
93.57 |
74.59 |
66.23 |
50.03 |
|
Other Manufacturing Expenses |
0.00 |
0.00 |
0.00 |
7.85 |
6.88 |
|
Selling and Admin Expenses |
0.00 |
0.00 |
0.00 |
61.02 |
39.98 |
|
Miscellaneous Expenses |
105.04 |
120.88 |
113.62 |
12.22 |
10.45 |
|
Total Expenses |
709.79 |
716.48 |
702.03 |
645.03 |
482.86 |
|
Operating Profit |
121.64 |
98.50 |
105.56 |
129.92 |
100.86 |
|
PBDIT |
127.41 |
111.49 |
117.55 |
135.05 |
70.13 |
|
PBDT |
126.63 |
111.34 |
117.55 |
133.68 |
69.15 |
|
Depreciation |
17.76 |
14.27 |
11.82 |
10.27 |
9.20 |
|
Profit Before Tax |
108.87 |
97.07 |
105.73 |
123.41 |
59.21 |
|
PBT (Post Extra-ord Items) |
108.87 |
97.07 |
105.73 |
123.41 |
59.21 |
|
Tax |
30.60 |
25.80 |
29.71 |
42.02 |
33.04 |
|
Reported Net Profit |
78.27 |
71.26 |
76.02 |
81.39 |
55.18 |
|
Total Value Addition |
205.71 |
222.30 |
195.51 |
154.07 |
112.09 |
|
Equity Dividend |
15.85 |
15.85 |
15.85 |
15.85 |
14.48 |
|
Corporate Dividend Tax |
2.69 |
2.69 |
2.57 |
2.57 |
2.46 |
|
Per share data (annualised) |
|
|
|
|
|
|
Shares in issue (lakhs) |
1,584.55 |
1,584.55 |
1,584.55 |
1,584.55 |
781.59 |
|
Earning Per Share (Rs) |
4.94 |
4.50 |
4.80 |
5.14 |
7.06 |
|
Equity Dividend (%) |
100.00 |
100.00 |
100.00 |
100.00 |
200.00 |
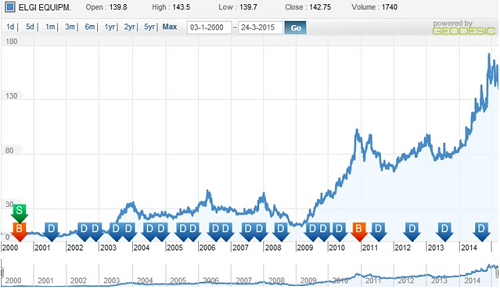
Dividend and Bonus History
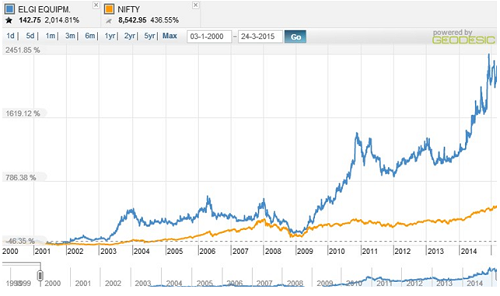
Index and Company Price Movement Comparison
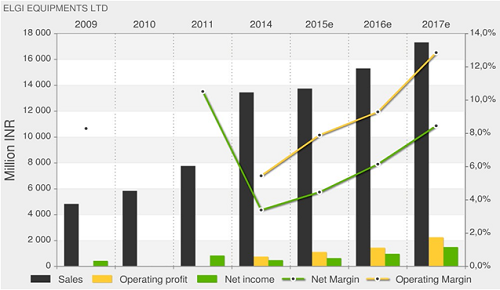
Company Forecast
Technical Indicators
|
Symbol |
Value |
Action |
|
RSI(14) |
63.918 |
Buy |
|
STOCH(9,6) |
61.915 |
Buy |
|
STOCHRSI(14) |
16.369 |
Oversold |
|
MACD(12,26) |
17.120 |
Buy |
|
ADX(14) |
76.159 |
Overbought |
|
Williams %R |
-39.401 |
Buy |
|
CCI(14) |
99.9926 |
Buy |
|
ATR(14) |
22.2750 |
High Volatility |
|
Highs/Lows(14) |
0.4750 |
Buy |
|
Ultimate Oscillator |
40.587 |
Sell |
|
ROC |
58.697 |
Buy |
|
Bull/Bear Power(13) |
52.3000 |
Buy |
Important Ratios (YoY)
-
PBIT – 12.45 v/s 10.15
-
RoCE – 15.00 v/s 17.00
-
RoE – 16.65 v/s 16.59
-
Net Profit Margin – 9.40 v/s 8.69
-
Return on net worth – 16.8 v/s 17.4
-
D/E Ratio – 0.19 v/s 0.05
-
Interest Cover – 141.10 v/s 661.32
-
Current Ratio – 2.25 v/s 2.04
-
Reserves – 480.20 cr v/s 420.47 cr
-
PAT – 78.27 cr v/s 71.26 cr
-
Total assets – 588.41 cr v/s 456.16 cr
-
Net sales – 828.33 cr v/s 816.54 cr
-
Book Value – 31.31 v/s 27.54
Simple Moving Average
|
Days |
BSE |
NSE |
|
30 |
149.00 |
149.42 |
|
50 |
153.19 |
153.40 |
|
150 |
142.57 |
142.72 |
|
200 |
136.79 |
136.91 |
Investment Rationalize
-
Elgi Equipments is one of the leading player in Indian Compressor market with a market share of 29% and CAGR of 13% in revenue current numbers stands at Rs.922 crore.
-
Elgi Equipments have invested heavily in increasing the manufacturing capacity and improvements in technology, which will intern help the company in order to capitalize on market demand for products when the economic condition and product demands increases.
-
Elgi Equipments Limited is able to sustain growth in revenue and profits even in the adverse market situations, at healthy Net Profit Margin of 9.40%.
-
Elgi Equipments Limited has expanded its presence in China, Brazil, Middle East and Australia through organic route and in US & Europe through inorganic route.
-
Company have inventory worth Rs.105.19 crore and help the management to capitalize the inventory when the demand for the product increases.
-
Governments policy of ‘Make in India’ and improvement sectors such as automobiles, engineering and construction will help the company to grow into new levels.
-
Elgi Equipments Ltd is able to maintain cash flow even after the scale of investments made by the company and have a reserves of Rs.480 crore.
-
Good after sales services and well quipped distribution network helps the company to meet market competition in an effective manner.
- Share :


Post a Comment
|
DISCLAIMER |
This report is only for the information of our customers. Recommendations, opinions, or suggestions are given with the understanding that readers acting on this information assume all risks involved. The information provided herein is not to be construed as an offer to buy or sell securities of any kind. ATS and/or its group companies do not as assume any responsibility or liability resulting from the use of such information.