Electrosteel Castings Ltd
|
Current price BSE |
20.90 |
|
Sector |
Casting and Forging |
|
No of shares |
343.82 Million |
|
52 week high |
36.90 |
|
52 week low |
14.52 |
|
BSE Sensex |
28503.30 |
|
Nifty |
8647.75 |
|
Average Volume BSE |
82570 |
|
Average Volume NSE |
303910 |
|
BSE Code |
5000128 |
|
NSE Symbol |
ELECTCAST |
Electrosteel Castings Ltd - Company Overview
Electrosteel Castings Ltd is largest manufacturer of ductile iron (DI) spun pipes in India. The company is a water infrastructure company providing techno-economic solutions for water supply and sewerage systems. They are engaged in the business of manufacturing Ductile Iron Pipes and Fittings and Cast Iron Pipes. They also undertake turnkey solutions for water transportation and sewerage management, which include manufacturing DI Pipes, supplying and laying various types of pipes, operating the system and transferring to the owners. The company is headquartered at Kolkata and having their manufacturing facilities at Elavur in Tamilnadu, Khardah and Haldia in West Bengal. Electrosteel Castings Ltd was incorporated in the year 1955.
To meet the ever growing demand of its quality products and with Electrosteel acquired 46% stake in Lanco Industries Limited in March 2002, which is involved in manufacturing of DI Pipes, Pig Iron, Cement and Castings.
With respect to strengthening India's own infrastructure, Electrosteel ventured into the Steel Manufacturing industry through its promoted Company Electrosteel Steels Limited. An Integrated Steel Plant has been set up which is capable of producing 2.5 Million metric tonnes of Hot Metal, which is further processed into Pig Iron, Billets, TMT Bars, Wire Rods and Ductile Iron Pipes.
Presently, over 60% of its products are exported around the world and Electrosteel has its subsidiaries in eleven countries.
The current market capitalisation stands at Rs 788.87 crore. The company has reported a standalone sales of Rs 597.44 crore and a Net Profit of Rs 15.76 crore for the quarter ended Dec 2014.
Electrosteel Castings Ltd - Share Holding Pattern
|
Category |
No. of Shares |
Percentage |
|
Promoters |
189,224,372 |
53.01 |
|
General Public |
75,319,327 |
21.10 |
|
Foreign - OCB |
27,480,414 |
7.70 |
|
Financial Institutions |
25,695,542 |
7.20 |
|
Other Companies |
24,137,278 |
6.76 |
|
Foreign Institutions |
7,425,814 |
2.08 |
|
NBFC and Mutual Funds |
3,000,200 |
0.84 |
|
Foreign - NRI |
2,294,332 |
0.64 |
|
Others |
273,043 |
0.08 |
Electrosteel Castings Ltd - Financial Overview
-
Market Cap (Rs Cr) – 788.87
-
Company P/E – 8.16
-
Industry P/E – 27.16
-
Book Value (Rs) – 61.71%
-
Dividend (%) – 65%
-
EPS (TTM) – 2.72
-
Dividend Yield (%) – 2.94%
-
Face Value (Rs) - 1
Industry Overview
The global forgings industry is expected to grow at a CAGR of 9.42% over 2012-2016. One of the key factors of growth in this sector is the increasing demand from the automotive industry and international forgings being outsourced from Asia and Africa.
The industry has grown by 32.1% in dealer's market worldwide and 40.2% in value during 2013, ensuring the profitability of the industry, globally. The deal value, which the forging industry achieved in 2012 was 203% higher than 2009, thereby widening the market. Asia dominated production in the realm of forging steel manufacture. In the overall business, there was a decline in the US and the European markets (Source: Global forging industry outlook, 2012-2016).
India's forgings industry currently operates at 60-70% of its operational efficiency. New technology and mass production could mean more efficiency and lower cost. As the demand for high quality heavy forged components rises in India, major industry players look for joint ventures and partnerships for capacity expansion and technology up-gradation. This creates opportunities for global players to establish or increase their presence in India.
The automobile industry in India has flourished at a healthy rate of 20% yoy from FY2006 to 2012, but has reported a slowdown with the current growth rate sliding under 8%.Over-dependence on the automobile sector could increase the risk for this industry. The12th Plan promises high growth for industry segments like power generation, petrochemicals and the ship building industries. This, in turn, is expected to generate a demand for heavy forged components. Based on this growth, demand for Indian forged components is predicted to rise up to 4.9 million tons by 2015-16. To meet this demand forging companies have already started expanding their capacities through joint ventures. Inclusion of non-auto components in their product portfolio will help them capitalize on the growing demand in the non-auto forging segment
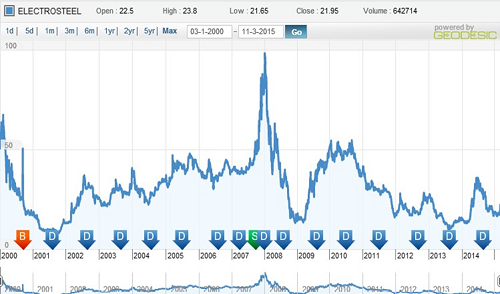
Dividend and Bonus History
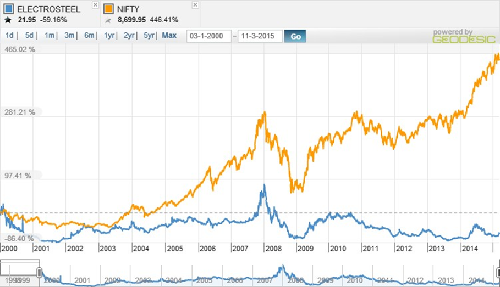
Index and Company Price Movement Comparison
Balance Sheet
|
|
Mar '14 |
Mar '13 |
Mar '12 |
Mar '11 |
Mar '10 |
|
Sources Of Funds |
|
|
|
|
|
|
Total Share Capital |
34.38 |
32.68 |
32.68 |
32.68 |
32.68 |
|
Equity Share Capital |
34.38 |
32.68 |
32.68 |
32.68 |
32.68 |
|
Reserves |
2,412.86 |
2,321.77 |
1,670.35 |
1,652.15 |
1,551.10 |
|
Networth |
2,447.24 |
2,354.45 |
1,703.03 |
1,684.83 |
1,583.78 |
|
Secured Loans |
2,167.69 |
1,875.09 |
1,284.84 |
1,240.57 |
1,129.74 |
|
Unsecured Loans |
34.29 |
187.81 |
247.44 |
231.06 |
112.19 |
|
Total Debt |
2,201.98 |
2,062.90 |
1,532.28 |
1,471.63 |
1,241.93 |
|
Total Liabilities |
4,649.22 |
4,417.35 |
3,235.31 |
3,156.46 |
2,825.71 |
|
Application Of Funds |
|
|
|
|
|
|
Gross Block |
1,641.16 |
1,583.97 |
987.40 |
914.36 |
842.01 |
|
Less: Accum. Depreciation |
546.53 |
489.47 |
431.92 |
376.31 |
317.38 |
|
Net Block |
1,094.63 |
1,094.50 |
555.48 |
538.05 |
524.63 |
|
Capital Work in Progress |
1,210.82 |
986.09 |
655.81 |
447.18 |
390.96 |
|
Investments |
1,099.96 |
1,142.60 |
1,118.72 |
1,399.88 |
1,023.96 |
|
Inventories |
556.80 |
451.74 |
552.94 |
519.80 |
356.73 |
|
Sundry Debtors |
616.86 |
656.61 |
619.20 |
488.63 |
374.11 |
|
Cash and Bank Balance |
228.84 |
320.44 |
156.47 |
15.04 |
10.36 |
|
Total Current Assets |
1,402.50 |
1,428.79 |
1,328.61 |
1,023.47 |
741.20 |
|
Loans and Advances |
600.09 |
333.98 |
412.72 |
209.29 |
239.42 |
|
Fixed Deposits |
0.00 |
0.00 |
0.00 |
174.70 |
270.56 |
|
Total CA, Loans & Advances |
2,002.59 |
1,762.77 |
1,741.33 |
1,407.46 |
1,251.18 |
|
Current Liabilities |
687.44 |
490.70 |
711.88 |
504.35 |
248.35 |
|
Provisions |
71.33 |
77.92 |
124.17 |
131.74 |
116.68 |
|
Total CL & Provisions |
758.77 |
568.62 |
836.05 |
636.09 |
365.03 |
|
Net Current Assets |
1,243.82 |
1,194.15 |
905.28 |
771.37 |
886.15 |
|
Total Assets |
4,649.23 |
4,417.34 |
3,235.29 |
3,156.48 |
2,825.70 |
|
Contingent Liabilities |
750.01 |
1,757.05 |
2,187.50 |
272.74 |
225.79 |
|
Book Value (Rs) |
71.18 |
72.06 |
52.12 |
51.56 |
48.47 |
Profit and Loss Account
|
|
Mar '14 |
Mar '13 |
Mar '12 |
Mar '11 |
Mar '10 |
|
Income |
|
|
|
|
|
|
Sales Turnover |
2,186.88 |
1,934.55 |
1,916.66 |
1,783.90 |
1,496.51 |
|
Excise Duty |
0.00 |
0.00 |
0.00 |
41.68 |
38.43 |
|
Net Sales |
2,186.88 |
1,934.55 |
1,916.66 |
1,742.22 |
1,458.08 |
|
Other Income |
19.70 |
95.05 |
70.77 |
54.81 |
62.02 |
|
Stock Adjustments |
29.64 |
-9.15 |
4.69 |
20.23 |
22.86 |
|
Total Income |
2,236.22 |
2,020.45 |
1,992.12 |
1,817.26 |
1,542.96 |
|
Expenditure |
|
|
|
|
|
|
Raw Materials |
1,260.07 |
1,141.05 |
1,168.14 |
998.65 |
746.33 |
|
Power & Fuel Cost |
158.15 |
148.46 |
142.12 |
126.41 |
105.16 |
|
Employee Cost |
148.76 |
137.49 |
123.09 |
122.87 |
106.08 |
|
Other Manufacturing Expenses |
0.00 |
0.00 |
0.00 |
17.65 |
21.89 |
|
Selling and Admin Expenses |
0.00 |
0.00 |
0.00 |
162.42 |
132.49 |
|
Miscellaneous Expenses |
344.48 |
308.14 |
381.28 |
45.29 |
54.84 |
|
Total Expenses |
1,911.46 |
1,735.14 |
1,814.63 |
1,473.29 |
1,166.79 |
|
Operating Profit |
305.06 |
190.26 |
106.72 |
289.16 |
314.15 |
|
PBDIT |
324.76 |
285.31 |
177.49 |
343.97 |
376.17 |
|
Interest |
135.82 |
111.24 |
100.65 |
78.60 |
46.40 |
|
PBDT |
188.94 |
174.07 |
76.84 |
265.37 |
329.77 |
|
Depreciation |
52.97 |
53.09 |
54.26 |
54.41 |
52.30 |
|
Profit Before Tax |
135.97 |
120.98 |
22.58 |
210.96 |
277.47 |
|
Extra-ordinary items |
0.00 |
0.00 |
0.00 |
3.92 |
28.41 |
|
PBT (Post Extra-ord Items) |
135.97 |
120.98 |
22.58 |
214.88 |
305.88 |
|
Tax |
35.41 |
23.75 |
-19.80 |
60.25 |
101.63 |
|
Reported Net Profit |
100.56 |
97.23 |
42.38 |
154.64 |
206.29 |
|
Total Value Addition |
651.40 |
594.09 |
646.48 |
474.64 |
420.46 |
|
Equity Dividend |
22.35 |
16.34 |
16.34 |
40.84 |
40.84 |
|
Corporate Dividend Tax |
3.80 |
2.78 |
2.65 |
6.63 |
6.78 |
|
Per share data (annualised) |
|
|
|
|
|
|
Shares in issue (lakhs) |
3,438.17 |
3,267.53 |
3,267.53 |
3,267.53 |
3,267.53 |
|
Earning Per Share (Rs) |
2.92 |
2.98 |
1.30 |
4.73 |
6.31 |
|
Equity Dividend (%) |
65.00 |
50.00 |
50.00 |
125.00 |
125.00 |
Important Ratios(YoY)
-
PBIT – 11.42 v/s 6.75
-
RoCE – 5.84 v/s 5.25
-
RoE – 4.10 v/s 5.29
-
Net Profit Margin – 4.55 v/s 4.79
-
Return on net worth – 4.10 v/s 4.12
-
D/E Ratio – 0.90 v/s 0.88
-
Interest Cover – 2.00 v/s 2.09
-
Current Ratio – 0.95 v/s 0.84
-
Reserves – 2412.89 cr v/s 2321.77 cr
-
PAT – 100.56 cr v/s 97.23 cr
-
Total assets – 4649.23 cr v/s 4417.34 cr
-
Net sales – 2186.88 cr v/s 1934.55 cr
-
Book Value – 77.18 v/s 72.06
Simple Moving Average
|
Days |
BSE |
NSE |
|
30 |
18.27 |
18.09 |
|
50 |
18.17 |
18.08 |
|
150 |
21.44 |
21.48 |
|
200 |
24.15 |
24.17 |
Technical Indicators
|
Symbol |
Value |
Action |
|
RSI(14) |
55.983 |
Buy |
|
STOCH(9,6) |
39.429 |
Sell |
|
STOCHRSI(14) |
100.000 |
Overbought |
|
MACD(12,26) |
-1.280 |
Sell |
|
ADX(14) |
26.920 |
Buy |
|
Williams %R |
-20.482 |
Buy |
|
CCI(14) |
268.9266 |
Overbought |
|
ATR(14) |
2.1643 |
Less Volatility |
|
Highs/Lows(14) |
2.2393 |
Buy |
|
Ultimate Oscillator |
46.352 |
Sell |
|
ROC |
3.828 |
Buy |
|
Bull/Bear Power(13) |
6.5480 |
Buy |
Investment Rationalize
-
Electrosteel Castings Ltd was able to sustain its revenue growth even in the adverse market situations. Reserves of the company stands at Rs.2447 Crores, which help the company in order internally finance its financial requirements.
-
The domestic demand of Ductile Iron pipes fittings and Cast Iron pipes are supposed to increase mainly due to major irrigation and water supply projects by the government.
-
Usage of cost effective manufacturing technology will add to the cost advantage of the company. Entry into South American and African markets as well as improving economic situation in European market will add to the companies revenue.
-
Advantage of first entry into market ie, Electrosteel Castings Ltd. is the first manufacturer of Ductile iron pipes in India.
-
Current market price of the stock is well below the book value of Rs.61. Which means the stock is available in discounted prices.
-
Growth forecast of the casting and forging industry and significant under performance of the company in the current market rally will add to the growth prospects of the company.
-
Electrosteel Castings Ltd is currently operates in very low capacity when it is compared with actual operational capacity, so increase in market demand will help the company to operate in optimum limits which in turn add on to sales.
- Share :


Post a Comment
|
DISCLAIMER |
This report is only for the information of our customers. Recommendations, opinions, or suggestions are given with the understanding that readers acting on this information assume all risks involved. The information provided herein is not to be construed as an offer to buy or sell securities of any kind. ATS and/or its group companies do not as assume any responsibility or liability resulting from the use of such information.