Cosmo Films
Cosmo Films Limited - Background
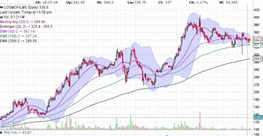
Cosmo Films Limited is an India-based manufacturer of bi-axially oriented polypropylene films (BOPP) and thermal films. The Company also exports BOPP film from India. Its products include packing films, which involve packaging of household brands and also include a range of packaging, label, print lamination, industrial and specialty films; laminating films, Cosmo Films, Inc., which manufactures thermal lamination films, and coated films, which the Company has a state-of-art coating facility for poly-vinylidene dichloride (PVDC), acrylic and PR coating. The Company operates in two segments namely Packaging films and Others. Its state-of-art manufacturing units are located in India, Korea and the United States. It has manufacturing facilities in India with an annual capacity of 91,000 metric tons (MT) in BOPP and 22,700 MT in thermal lamination. Some of its subsidiaries include CF Global Holdings Limited (CGH), CF (Mauritius) Holdings Limited (CMH) and Cosmo Films, Inc. (CFI).
|
BSE Code |
508814 |
|
NSE Code |
COSMOFILMS |
|
Reuters Code |
CSFL.BOO |
|
CMP (as on 21/07/2016) |
340.00 |
|
Stock Beta |
1.42 |
|
52 Week H/L |
407.90/107.10 |
|
Market Cap (Cr) |
661.74 |
|
Equity Capital (Rs cr) |
19.44 |
|
Face Value (Rs) |
10 |
|
Average Volume |
190331 |
|
|
|
|
Shareholding Pattern (%) |
|
|
Promoters |
43.51 |
|
Non Institutions |
56.49 |
|
Grand Total |
100 |
Cosmo Films Limited - Investment Rationale
-
Wide product portfolio
-
Significant room for growth
-
GST to improve consumption
-
Capex and VAP to drive topline
-
Strong client base
Cosmo Films Limited - Risks and Concerns
-
Competition from unorganized sector
-
Changes in manufacturing cost
Cosmo Films Limited - Conclusion & Recommendation
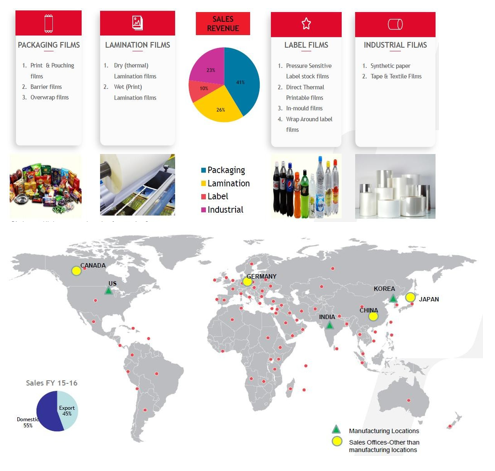
Cosmo Films is one of the lowest cost BOPP manufacturer and is the fifth largest player in the world. Being a dominant player it is strategically placed to exploit growth opportunities in the flexible packaging industry given the wide range of its products portfolio. . The company manufactures packaging films, lamination films, label films and industrial films for various packaging applications. With strong client base and implementation of GST will increase the consumption of its products and provides vast opportunity to grow in the niche product segment. We expect company to outperform its peers in medium and long term.
At the current market price of Rs.340 the stock is trading at ~4x FY18E EPS. Investors could buy the stock at CMP and add on dips to around Rs.310 to Rs.300 levels (~3.5x FY18E EPS) for the sequential targets of Rs.420 and Rs.500 (~4.6x to ~5.5x FY18E EPS).
Cosmo Films Limited Financial Summary
|
Particulars (Rs. in Crs) |
FY14 |
FY15 |
FY16 |
FY17E |
FY18E |
|
Net Sales |
1456.50 |
1640.56 |
1615.58 |
1811.61 |
2173.93 |
|
Operating Profit |
86.74 |
112.64 |
189.90 |
245.85 |
313.83 |
|
PAT |
-5.50 |
27.66 |
96.24 |
128.14 |
179.52 |
|
EPS (Rs.) |
-2.76 |
13.87 |
48.26 |
64.26 |
90.03 |
|
PE |
-123.27 |
24.51 |
7.04 |
5.29 |
3.78 |
Cosmo Films Limited - Company Profile
Investment Rationale
Wide product portfolio
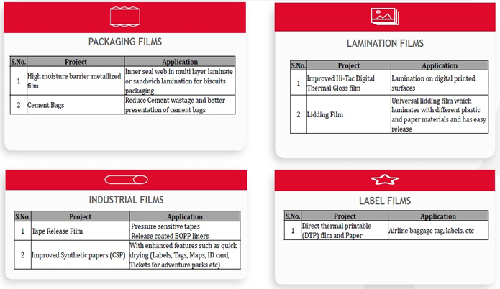
Cosmo Films Ltd has a strong presence in flexible packaging films and specialty films industry. In speciality films segment beside thermal films, wet lamination, synthetic paper, high barrier films, coated films are key products. Cosmo is the largest producer of thermal lamination films in the world. In commodity, Cosmo manufactures tape and textile films as well as packaging films. Within the packaging segment, company manufactures films such as heat sealable, plain, metallized, opaque films as well as speciality films such as stable slip film, low SIT films, high hot tack films, low COF films and extrusion coatable metallized films. In labels Cosmo has almost a complete range of films for wrap-around, in-mould and self adhesive applications in transparent, metallized and opaque which can work with almost all kinds of printing inks. The broad product portfolio will enable Cosmo to capitalize on the demand arising from different segments in the industry and to hedge the risk associated with single product companies.
Significant room for growth
The growth rate of the Indian plastics industry is one of the highest in the world, with plastics consumption growing at 16% per annum (compared to 10% p.a. in China and around 2.5% p.a. in the UK). With a growing middle class and a low per capita consumption of plastics, currently 8kg per head, this trend is likely to continue. The plastics consumption is likely to reach 16kg per head by this year. Packaging currently accounts for the largest consumption of plastics in India, at 24% of overall consumption. The historical growth of the plastic industry over the last few decades is at an impressive 12-14% which is almost twice the GDP growth. The major driver of this growth is the increased standard of living of people in India. Considering low packaged food penetration in India and rising personal disposable income, the Industry is estimated to grow fast. Investment in organized retail industry and change in pack format from rigid to flexible is going to further add to increasing demand. Based on capacity addition announced in India, new capacity expected in the Industry may not be able to address growing India demand. On current India BOPP Industry demand base, one new line each year may not be sufficient to address India’s growing demand. Cosmo with its capacities and
GST to improve consumption
The goods and services tax (GST) is being talked about as the single most powerful tax reform that India will see. The objective is to end the regime of multiple taxes on goods and services and bring them under one rate. The system will change from the current production-based taxation to being consumption-based. Along with bringing about a semblance of uniformity in taxes across states, this is expected to increase efficiency and compliance in the system. For manufactured consumer goods, the current tax regime means the consumer pays approximately 25-26% more than the cost of production due to excise duty (peak of about 12.5%) and value-added tax. While there hasn’t been any indication of a GST rate, experts suggest between 18% and 22%. Given this, basic goods are likely to become marginally cheaper. There is no doubt that in the production and distribution of goods, services are increasingly used or consumed and vice versa. Unorganized players are currently out of the tax net and thus enjoy lower costs by evading taxes. After the introduction of GST, the tax advantage enjoyed by the unorganized players would diminish sharply and the market share of the organized players is likely to increase significantly, benefiting big name listed players. The organized sector would gain market share from unorganized players due to a shift in consumer preference for quality retreading products. Also, implementation of the GST, going forward, could reduce the pricing gap between organized and unorganized players, thereby rendering the organized players' pricing equally attractive which adds to the growth potential of the company.
Capex and VAP to drive topline
Cosmo Films Limited over the next three years is undertaking a capex of Rs 244 crore to expand capacities and upgrading techonology across BOPP, thermal, coating and metalizing films. With the completion of capex, Cosmo will have BOPP will have a capacity of 1.96lakh TPA and 22000 TPA in matazling. Newly planned capacity expansion by 44% with one of the world’s largest and most efficient production capability at low financing cost would further help higher asset turnover along with improved ratios. With the increase in demand for its products Cosmo will be able to increase its capacity utilization from the current levels of ~67% and adding extra capacity will further add to the growth prospects of the company. Cosmo Films is one of the lowest costs BOPP manufacturer and is the fifth largest player in the world. Rise in revenue contribution from the current level of ~25% to the overall revenue from value-added products especially specialty films in total sales, cost containment measures which and turnaround in US subsidiary’s profitability are key drivers for improvement in core earnings over the next two years.
Strong client base
Cosmo's customer base includes the leading global flexible packaging and label face stock manufacturers like Amcor, Constantia, Huhtamaki, Avery Dennison, etc., which service brands like Pepsico, Coca Cola, Unilever, P&G, CP, Reckitt Benckiser, Nestle, Mars, etc. Cosmo also has an extensive network of channel partners across the world for the distribution of its range of lamination films. With the growth prospects of the end-user industry and company looking bright, Cosmo will be a key beneficiary.
Industry Profile
The Indian packaging industry constitutes about 4 percent of the global packaging industry. The per capita packaging consumption in India is quite low at 4.3 kgs, compared to countries like Germany and Taiwan where it is 42 kgs and 19 kgs respectively. However, organised retail and boom in e-commerce, which offer huge potential for future growth of retailing, is giving a boost to the packaging sector. Today, plastics are the material of choice in packaging for the sectors such as FMCG, food and beverages, pharmaceuticals etc. Globally, plastics comprise of 42 percent of packaging with the combination of rigid and flexible plastics in packaging. Plastics are used heavily for packaging due to innovative visual appeal for customer attraction and convenience. Additionally, they improve the hygiene quotient and shelf-life of the products especially in food and beverages segment
The packaging industry in India is expected to reach $ 73 billion in 2020 from $ 32 billion in FY 15, according to a report prepared by FICCI and Tata Strategic Management Group (TSMG) on plastic industry titled ‘Plastic packaging: The sustainable choice’. In the coming years, Indian packaging industry is anticipated to register 18 percent annual growth rate, with the flexible packaging and rigid packaging expected to grow annually at 25 percent and 15 percent, respectively. Indian food service industry, which currently is estimated to be nearly $13.79 billion. But it’s growing at a healthy compound annual growth rate (CAGR) of 17 per cent, which has significant implications for the packaging sector. Plans are currently in place, thanks to public and private funding, to establish 30 to 40 mega food parks. Corresponding infrastructure for packing, packaging transport, and refrigeration are part of these plans, so this development is expected to give food manufacturing—and, by extension, packaging—a big boost. In fact, by 2015 more than $25 billion is to be pumped into the food sector and the required infrastructure.
Packaging has an annual global turnover of about $550 billion, and India’s share is about $16.5 billion per annum. According to a recent Mckinsey report, there will be a ten-fold increase in India’s middle-class population by 2025, which will further trigger the consumption of packaging materials. This will bring another growth spurt to packaging, says a market report, which also notes that the country needs more packaging professionals. According to the Packaging Industry Association of India (PIAI), packaging in India is one of the fastest-growing sectors, partly because it spans almost every industry segment. Right from packaging of food and beverages, fruits and vegetables, drugs and medicines, to highly dangerous products, packaging has led to greater specialization and sophistication over a period of years.
At present, the Indian Packaging Industry is ranked 11th in the world, and industry experts are of the opinion that packaging in India is expected to grow to $16.5 billion by 2015. However, according to a report conducted by the New Delhi-based Centre for Market Research & Social Development, packaging in India is highly fragmented and has 22,000 firms, including raw material manufacturers, machinery suppliers, and providers of ancillary materials and services. Moreover, 85% of these firms are Micro, Small & Medium Enterprises (MSMEs). As the industry grows and matures, there is expected to be a trend towards consolidation as supply-side companies merge and acquire smaller companies to increase scale, reduce competition, and improve bargaining power with customers, the report said.
The packaging market in India seems set for the next level of growth. Strong favorable demographic factors such as increasing disposable income levels and rising consumer awareness and demand for processed food are helpful. So is the rise of the Indian middle class, which is expected to go from today’s 50 million to 583 million in 2025. Also important is that the world’s multinational giants are taking rapid strides in India’s food, beverage, health and beauty, and pharmaceuticals sectors. This will also drive growth in packaging. These factors are forcing both packaging suppliers and end-users to shift from bulk packaging to retail, unit-level, small-sized packaging. In addition, exploding organized retail growth and newly relaxed investment norms in retail and other sectors augur well for the packaging market in India.
Risks and Concerns
Competition from unorganized sector
There is a large number of unorganized players in the packaging industry market delivering products at different standards. Cosmo is exposed to high completion from these players both in domestic and international markets.
Changes in manufacturing cost
Cost of production of its different products makes the maximum share of its expenses. The increase in the price of key raw materials of crude oil derivatives can affect the profit margin of the company.
Financials
Q4 FY16
|
|
4th Qtr201603 |
4th Qtr201503 |
VAR[%] |
4th Qtr201603 |
3rd Qtr201512 |
VAR[%] |
|
Gross Sales |
384.74 |
390.12 |
-1.4 |
384.74 |
388.02 |
-0.8 |
|
Net Sales |
384.74 |
390.12 |
-1.4 |
384.74 |
388.02 |
-0.8 |
|
Other Operating Income |
1.62 |
1.56 |
3.8 |
1.62 |
1.24 |
30.6 |
|
Other Income |
3.48 |
9.4 |
-63 |
3.48 |
0.54 |
544 |
|
Total Income |
389.84 |
401.08 |
-2.8 |
389.84 |
389.8 |
0.0 |
|
Total Expenditure |
340.92 |
356.95 |
-4.5 |
340.92 |
344.88 |
-1.1 |
|
PBIDT |
48.92 |
44.13 |
10.9 |
48.92 |
44.92 |
8.9 |
|
Interest |
7.61 |
10.64 |
-28.5 |
7.61 |
7.06 |
7.8 |
|
PBDT |
41.31 |
33.49 |
23.4 |
41.31 |
37.86 |
9.1 |
|
Depreciation |
9.13 |
8.43 |
8.3 |
9.13 |
9.01 |
1.3 |
|
PBT |
32.18 |
25.06 |
28.4 |
32.18 |
28.85 |
11.5 |
|
Tax |
8.07 |
10.74 |
-24.9 |
8.07 |
-4.08 |
-297.8 |
|
Reported Profit After Tax |
24.11 |
14.32 |
68.4 |
24.11 |
32.93 |
-26.8 |
|
NP after Minority Int & P/L Asso.Co. |
24.11 |
14.32 |
68.4 |
24.11 |
32.93 |
-26.8 |
|
Extra-ordinary Items |
-2.15 |
3.93 |
-154.7 |
-2.15 |
-1.46 |
4.7 |
|
AdjProfit After Extra-ordinary item |
26.26 |
10.39 |
152.7 |
26.26 |
34.39 |
-2.4 |
|
|
|
|
|
|
|
|
|
PBIDTM(%) |
12.72 |
11.31 |
12.5 |
12.72 |
11.58 |
9.8 |
|
PBDTM(%) |
10.74 |
8.58 |
25.2 |
10.74 |
9.76 |
10.0 |
|
PATM(%) |
6.27 |
3.67 |
70.8 |
6.27 |
8.49 |
-26.1 |
Profit and Loss Account (as per rough estimates)
|
|
FY14 |
FY15 |
FY16 |
FY17E |
FY18E |
|
Gross Sales |
1456.5 |
1640.56 |
1615.58 |
1811.61 |
2173.93 |
|
Net Sales |
1456.5 |
1640.56 |
1615.58 |
1811.61 |
2173.93 |
|
Other Operating Income |
11.86 |
6.22 |
5.04 |
4.86 |
4.68 |
|
Other Income |
6.77 |
8.28 |
5.54 |
5.48 |
4.80 |
|
Total Income |
1475.13 |
1655.06 |
1626.16 |
1821.95 |
2183.41 |
|
Total Expenditure |
1388.39 |
1542.42 |
1436.26 |
1576.10 |
1869.58 |
|
PBIDT |
86.74 |
112.64 |
189.9 |
245.85 |
313.83 |
|
Interest |
43.22 |
39.88 |
30.18 |
35.02 |
33.05 |
|
PBDT |
43.52 |
72.76 |
159.72 |
210.84 |
280.77 |
|
Depreciation |
45.32 |
34.54 |
35.68 |
39.99 |
41.42 |
|
PBT |
-1.8 |
38.22 |
124.04 |
170.85 |
239.36 |
|
Tax |
3.7 |
10.56 |
27.8 |
42.71 |
59.84 |
|
Reported Profit After Tax |
-5.5 |
27.66 |
96.24 |
128.14 |
179.52 |
|
NP after Minority Interest & P/L Asso.Co. |
-5.5 |
27.66 |
96.24 |
128.14 |
179.52 |
|
|
|
|
|
|
|
|
PBIDTM(%) |
5.96 |
6.87 |
11.75 |
13.57 |
14.44 |
|
PBDTM(%) |
2.99 |
4.44 |
9.89 |
11.64 |
12.92 |
|
PATM(%) |
-0.38 |
1.69 |
5.96 |
7.12 |
8.26 |
Balance Sheet (as per rough estimates)
|
|
FY14 |
FY15 |
FY16 |
FY17E |
FY18E |
|
SOURCES OF FUNDS: |
|
|
|
|
|
|
Share Capital |
19.44 |
19.44 |
19.44 |
19.44 |
19.44 |
|
Reserves & Surplus |
340.54 |
361.18 |
436.83 |
494.88 |
575.64 |
|
Loan Funds |
525.31 |
411.82 |
343.95 |
393.44 |
384.35 |
|
Deferred Tax Liability |
51.47 |
57.19 |
78.81 |
75.39 |
80.92 |
|
Other Liabilities |
0.13 |
0 |
0 |
0.00 |
0.00 |
|
Total Liabilities |
936.89 |
849.63 |
879.03 |
983.15 |
1060.35 |
|
APPLICATION OF FUNDS: |
|
|
|
|
|
|
Fixed Assets |
638.55 |
609.49 |
659.27 |
740.51 |
739.56 |
|
Investments |
29.6 |
35.53 |
30.8 |
33.18 |
33.78 |
|
Current Assets, Loans & Advances |
476.16 |
403.88 |
405.6 |
451.22 |
548.52 |
|
Inventories |
202.44 |
179.54 |
172.04 |
204.27 |
236.51 |
|
Sundry Debtors |
138.26 |
121.95 |
117.44 |
117.38 |
142.03 |
|
Cash & Bank Balance |
59.97 |
25.01 |
32.35 |
32.40 |
48.68 |
|
Other Current Assets |
1.42 |
4.88 |
0.34 |
1.13 |
0.59 |
|
Loans & Advances |
74.07 |
72.5 |
83.43 |
96.03 |
120.71 |
|
Current Liabilities & Provisions |
213.87 |
229.7 |
262.87 |
280.81 |
303.92 |
|
Current Liabilities |
209.84 |
215.71 |
257.98 |
274.57 |
298.36 |
|
Provisions |
4.03 |
13.99 |
4.89 |
6.24 |
5.56 |
|
Net Current Assets |
262.29 |
174.18 |
142.73 |
170.41 |
244.59 |
|
Other Assets |
6.45 |
30.43 |
46.23 |
39.05 |
42.42 |
|
Total Assets |
936.89 |
849.63 |
879.03 |
983.15 |
1060.35 |
Conclusion and Recommendation
We are positive on Cosmo Films Ltd over the long term and hence recommend a BUY at CMP of RS.340.00 and further add on declines between Rs.310 to Rs.300 for a target of Rs.420 to Rs.500 with stop loss maintained at Rs.280.
- Share :


Post a Comment
|
DISCLAIMER |
This report is only for the information of our customers. Recommendations, opinions, or suggestions are given with the understanding that readers acting on this information assume all risks involved. The information provided herein is not to be construed as an offer to buy or sell securities of any kind. ATS and/or its group companies do not as assume any responsibility or liability resulting from the use of such information.