Bharat Forge
Background
Bharat Forge Limited is engaged in the business of steel forgings, finished machined crankshafts, and front axles assembly and components. The Company's segments include Forgings and Projects (Capital goods). Forgings produce and sells steel forging products comprising forgings, finished machined crankshafts, front axle assembly and components, and ring rolling, among others. Projects (Capital goods) include engineering, procurement, and commissioning business for power and infrastructure-related projects. It manufactures a range of components for various sectors, including automobiles (across commercial and passenger vehicles), oil and gas, aerospace, locomotives, marine, energy (across renewable and non-renewable sources), construction, mining, and general engineering. It has factories at Pune, Satara, and Baramati. Its manufacturing facilities are spread across India, Germany, France, and Sweden. It operates in Delhi, Noida, Hyderabad, Jamshedpur, Kolkata, Chennai, and Mumbai
|
BSE Code |
500493 |
|
NSE Code |
BHARATFORG |
|
Reuters Code |
BFRG.NS |
|
CMP (as on 21/12/2016) |
935.25 |
|
Stock Beta |
1.02 |
|
52 Week H/L |
1008.45/682.00 |
|
Market Cap (Cr) |
16776.06 |
|
Equity Capital (Rs cr) |
46.57 |
|
Face Value (Rs) |
2 |
|
Average Volume |
6924 |
|
|
|
|
Shareholding Pattern (%) |
|
|
Promoters |
46.74 |
|
Institutions |
33.61 |
|
Non Institutions |
19.64 |
|
Grand Total |
99.99 |
|
|
|
|
DECISION MATRIX |
|
|
Rating |
BUY |
|
Target |
1251 |
|
Period |
6-9 months |
|
Upward Movement |
30% |
Bharat Forge Limited - Investment Rationale
-
Decline in steel price
-
Increase in Demand for CV segment
-
Expansion in Europe and US through active M&A Strategy
-
Highly diversified clientele
Bharat Forge Limited - Risks and Concerns
-
Uncertainty in crude oil price
-
Stringent Emission Norms
-
Implementation of Demonetization
Conclusion & Recommendation
Bharat Forge Limited is a global player with strong presence in foreign markets because of product quality in its Passenger and commerce vehicle business. With healthy balance sheet, superior linkage of OEMs, strong product pipeline we expect company to outperform the industry in the both medium term and long term future.
At the current market price of Rs.935 the stock is trading at ~17x FY20E EPS. Investors could buy the stock at CMP and add on dips to around Rs.900 to Rs.930 levels (~16x FY18E EPS) for our sequential targets of Rs.1251 and Rs.1267 (~22x to ~23x FY20E EPS).
Financial Summary Standalone [ MP -935rs]
|
Particulars (Rs. in Crs) |
FY16 |
FY17E |
FY18E |
FY19E |
FY20E |
|
Net Sales |
4305.41 |
4504.10 |
4749.42 |
5041.8 |
5403.58 |
|
Operating Profit |
1378.67 |
1416.40 |
1478.16 |
1567.77 |
1700.24 |
|
PAT |
702.12 |
721.35 |
758.48 |
814.74 |
898.88 |
|
EPS (Rs.) |
28.58 |
33.57 |
39.49 |
45.67 |
53.38 |
|
PE (x) |
32.71 |
27.85 |
23.67 |
20.47 |
17.51 |
Bharat Forge Limited - Business Profile
Bharat forge Ltd is a Pune base manufacturing company established in 1961,which has a strong presence in the automotive, power, oil and gas, construction and mining, locomotive, marine and aerospace industries. It has manufacturing facility across the global in 10 locations. It has 4,766 permanent employees working across the globe. It has filed 22 patents till date out of which 2 were granted last year.
Automotive:
Automotive segment is the main contributor with 63% of revenue coming from passenger vehicle and commercial vehicle combined together. It has tie up with foreign truck manufactures which increases the exports of the company in CV market. It manufactures more than 10 components which cater to both passenger and commercial vehicles.
|
AUTOMOTIVE SECTOR ( in kgs) |
|||||
|
Segments |
Power Train |
Chassis |
Transmission Parts |
||
|
|
CRANK SHAFTS |
CONNECTING RODS |
FRONT AXLE |
STEERING KNUCKLES |
|
|
PV |
10 to 30 |
<1 |
|
2 to 10 |
0.5 to 6 |
|
LCV/MCV |
25 to 80 |
1 to 3 |
30 to 60 |
10 to 30 |
3 to 30 |
|
HCV |
60 to 250 |
2 to 5 |
60 to 150 |
25 to 40 |
20 to 100 |
Along with this it manufactures pistons, rocker arms, control arms, swivel hubs, wheel carriers and brackets.
Industrial Sector
Bharat forge in industrial sector has concentrated in three sector mainly Energy, transportation, Construction and mining. Each of these segments are gaining more traction in domestic markets because of the support from the government for private companies in the field of Defense and Energy sector. On International markets oil and Energy market is gaining more prominence in Europe as it has acquired companies to increase it market share.
Revenue Contribution:
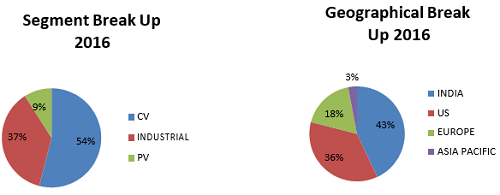
America is the major contributor and majority of the revenue coming from Commercial vehicle market but growth rate is expected to be high in Europe because of its presence in Oil and Energy segment along with automotive sector.
EQUITY FUND HOLDING:
|
Fund |
Market Value Oct2016 |
No of Shares Oct2016 |
|
Birla Sun Life Mutual Fund |
0.2466 |
2789 |
|
Canara Robeco Mutual Fund |
41.9454 |
474014 |
|
Franklin Templeton Mutual Fund |
1.0056 |
11364 |
|
Goldman Sachs Mutual Fund |
1.9797 |
22390 |
|
ICICI Prudential Mutual Fund |
157.2613 |
1778572 |
|
IDBI Mutual Fund |
16.8425 |
190332 |
|
IDFC Mutual Fund |
7.0382 |
79600 |
|
JM Financial Mutual Fund |
5.7612 |
65157 |
|
Kotak Mahindra Mutual Fund |
27.7756 |
314132 |
|
L&T Mutual Fund |
39.7789 |
449530 |
|
LIC Mutual Fund |
17.2707 |
195172 |
|
Mirae Asset Mutual Fund |
10.4205 |
117759 |
|
Reliance Mutual Fund |
641.523 |
7249665 |
|
Religare Invesco Mutual Fund |
16.7322 |
189235 |
|
Taurus Mutual Fund |
0.2134 |
2414 |
|
UTI Mutual Fund |
290.8063 |
3286319 |
Bharat Forge Limited - Investment Rationales
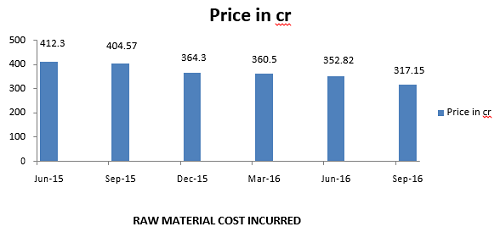
Decline in Steel prices
Cost of raw material accounts for 40.52% of total expense (standalone) as of March 2016. Steel is the used in manufacturing the majority of automotive components like crankshaft, connecting rod, piston and wheel carriers Decline in steel price has increased the margins of the company. We are expecting a further decline in price because of the decrease in demand of China market which is world’s largest consumer facing the economic growth pressure. We are expecting price of the metal will trade in the range of 440$-510$ for the next two quarters Slow down in construction activities in India because of the government decision of demonetization has led to further reduction in steel price Bharat forge with superior technology is working on decreasing the overall operation costs which will improve the domestic margins.
Increase in demand for Commercial vehicles
Commercial vehicle segment which contributes 54% of revenue is expected to grow for the next 5 year as there is an increase in demand for Class 8 trucks in North America and Europe. Tata Motors, Ashok Leyland, and Mahindra contribute to 85%-90% market share as of Sep 2016, in India have tremendous growth in sales during 2015-16. The Indian commercial vehicle market is expected to register a double growth t0 1.6 million units for the next five years. Replacement of fleet vehicles, tighter emission norms, lower diesel prices, and increase in infrastructure spending augmented the growth of the market. Domestic sales of the commercial vehicle segment for Bharat forge increased from 43% in 2015 to 49% in 2016 and exports increased from 47% in 2015 to 57% in 2016. Bharat forges also seen an exponential rise in demand for the passenger vehicle segment with exports increasing by 87%. It is a key supplier to Indian OEM’s Tata Motors, Ashok Leyland, Swaraj Mazda, Mahindra, and Mahindra. In foreign markets, it has deepened its network while supplier for major OEMs like Daimler, BMW, Toyota, Volkswagen, Scania, DAF, Volvo, GM, and Detroit Diesel. NAFTA region in North America will be the main traction for Bharat forge as it is expected to witness the demand from early 2017. Europe will see a surge in demand for commercial vehicles as this is the main source for transportation of heavy materials in Italy, France, Germany.
Passenger vehicles contribution has decreased from 16% to 11% due to an increase in competition as there are many local components manufacturers competing in the market which impacted the margins in the overall auto ancillary industry.
Expansion in Europe and US through active M&A Strategy
Bharat forge so far gained from the active merger and acquisition strategy starting from the major acquisition of (CDP) Carl Dan Peddinghaus GmbH major forging company in Germany, through this acquisition Bharat forge became a major supplier for leading automakers like BMW, Volkswagen, Audi, DaimlerChrysler, and Volvo. CDP which manufactures steel and aluminum forgings for passenger cars and SUVs front axles has deep customer relationships and provides end-to-end solutions based on its extensive technology, product design. BFL acquired Dana Corporations thereby providing all processes which include forging, dies casting, design, and tools, which helps to strengthen the crankshaft and camshaft forging business in Europe. Recently Bharat Forge Ltd (BFL) through its German subsidiary CDP Bharat Forge GmbH has acquired French oil & gas machining company Mecanique Generale Langroise (MGL) for $14.27 million (€11.8 million or Rs 90 crore). The acquisition will help Bharat Forge to further consolidate its position in the oil & gas space by enhancing service offerings in North America. The acquisitions that happened during 2005-2010 are all undervalued where the majority of the foreign companies are struggling financially although the performance is solid. Bharat forge is expected to benefit from the acquisitions as the demand is increasing globally and exposure in Non-auto business has given positive impact as there is a chance to go for forwarding/backward integration.
Bharat forge also acquired Walker forge Tennessee [WFT] for USD 14 million through its subsidiary Bharat Forge America. WFT is a manufacturer of complex, steel, and high alloy steel, engine, and chassis components that serve across the automotive and industrial sectors. Bharat Forge through this acquisition is expected to generate revenue of USD 28 million for fiscal 2016-17.
Bharat forge efforts to increase the international market share come at a cost because of the different labor unions and culture differences. It is looking to benefit from the US and Europe as there is growth in the global economy which will impact its operating margins in a positive manner.
Highly Diversified Clientele
Bharat forge is having long-term relations with domestic and global automakers. The diversification to industrial has increased its global presence. It is a prominent supplier for more than 15 plus global automakers with each contributing less than 6% of its revenues. It is also the prominent supplier for more than 20 plus companies like the caterpillar, John deere, Cameron, Perkins, Siemens, GE, Essar, Wartsila, Halliburton. In the automotive segment, it is a supplier for global automakers Daimler, General Motors, Chrysler, Detroit Diesel, Volvo, DAF, Renault, Scania, Man, MAHLE, and SAAB. Acquisition of Imatra Kilsta AB has given access to European automakers as Imatra forging is the global largest manufacturer of front axle beams and second-largest crankshaft manufacturer in Europe.
Increase in demand in Energy and Defense Sector
Energy and defense verticals have increased in demand as the company made a bid to manufacture defense vehicles for the Indian defense sector. The government defense procurement procedure scheme has provided wide opportunities for private companies in defense as the government is looking to stabilize India on developing its own technology instead of outsourcing. There is a requirement of 4,000 guns for the next 20- 25 years which will be used in army combats. Tractor exports sales in October have been increased by 61% from 801 units to 1351 units and a 34% increase from 135685 units to 181430 units during 2015-16.
Tata Motors, Bharat Forge Limited, and General Dynamics Land Systems (GDLS) of the US entered into an agreement for the Indian Ministry of Defence (MoD’s) prestigious Future Infantry Combat Vehicle (FICV) project worth Rs50,000cr. This is a 25-year long-term project, where Tata Motors will lead the consortium, with Bharat Forge Limited as a partner, while General Dynamics Land Systems will bring in its much-proven expertise in combat vehicle platforms. the FICV is a high mobility armored battle vehicle, for infantrymen to keep pace with new advancements in weaponry systems. The FICV needs to be compact, tracked, and amphibious, no heavier than 18-20 tonnes, so that it can be air-portable and transportable by other means, onto combat zones. The FICV will replace the Indian Army’s fleet of 2610 Russian-designed BMP (Sarath BMP-II) series armed vehicles, that are in operation since 1980.
Boeing has partnered with Bharat Forge for a supply of titanium forgings to be used in the wings of next-generation 737 and 737 MAX. This is a multi-year contract, Under the agreement, Bharat forge will supply pre-machined forgings from its facilities in Pune and Baramati to Boeing. The titanium parts will be heat-treated, shaped in a forging press, and machined by Bharat forge before being shipped to Boeing for finish machining into components. The components will, then, be installed in 737 and 737 MAX wings at Boeing’s assembly plant at Renton in Washington.
|
GLOBAL FORGING CAPACITY |
BHARAT FORGE |
|
GEOGRAPHY |
CAPACITY(TPA) |
|
INDIA |
403,750 |
|
EUROPE |
185,000 |
|
TOTAL |
588,750 |
Increase in Margins and Scaled-up production in forging
Bharat forge has a slight increase in EBITDA margins from 30.13% in 2015 to 30.66%, ROCE decreased from 23.30% in 2015 to 20.53%. Constant Dividend of 335% on face value from last 2 years company has increased its portfolio in Commercial vehicle segment and Industrial segment from Oil and Energy sector and Defense sector. With the Recovery of US markets, it is expected the margins for 2017-18 to increase drastically and its presence in the domestic industrial sector will increase the margins.
Industry Overview
India is one of the automotive largest manufacturers of both commercial vehicle and passenger vehicle segments. India’s GDP grew by 7.6% in FY 2015-16 primarily aided by policy initiatives of the Government of India, despite the contraction of global exports and two consecutive years of inadequate rainfall. The Government is focusing on strengthening the economy with various reform measures; and is aiming to improve both social and physical infrastructure in order to set structural drivers for long-term sustainable economic growth. The country’s total automobile production grew by 7% compared to the previous year. A slew of product launches at attractive prices, softening interest rates, and benign fuel prices played a big role in driving consumer demand.
Indian market after witnessing a sharp drop in sales in FY 2013-14, the M&HCV segment has registered a strong volume growth of 21% and 28%, respectively in FY 2014-15 and FY 2015-16. This growth was driven by strong fleet replacement and renewal demand on the back of the improving profitability for operators on declining diesel prices, the lower interest cost, and firm freight rates. The demand from various SRTUs as well as some demand escalation from high tonnage trucks in the mining and construction sectors also remained robust. Stricter emission norms for old vehicles and mandatory adoption of safety devices on all new trucking platforms are leading to a strong impetus for fleet replacement. Government emphasis on the usage of alternate fuels in order to provide a sustainable environment is going to propel the tractor industry in the long term. As technology emerged the dependence on gasoline engines has been reduced and OEMs are focusing usage of CNG, LNG as fuel for the 4 wheelers.
Risks and Concerns
Uncertainty in crude oil price
The fall in oil prices comes at a good time for the automotive industry. Global light vehicle sales recovered nicely from the 2009 recession with China’s fast-growing market providing much of the growth. However, global sales show little improvement over the last year due to a moderating China vehicle market, a weak European recovery, and economic troubles in Eastern Europe and South America. In this environment, lower oil prices will help drive vehicle sales through stronger economic growth for most countries, and by lowering operating costs, making personal transportation more affordable for all consumers. The light vehicle market already had a strong growth outlook with IHS Automotive forecasting over 760 million sales between 2014 and 2021, a 33% increase over the previous eight year period, and lower oil prices will contribute to even more upside potential. The direct impact of low oil prices alone on vehicle purchases is difficult to quantify, but IHS Automotive estimates sales could rise an additional 5-7 million units over the forecast horizon.
However with a lot of political uncertainty and OPEC not getting a major consensus during their recent meeting the Oil price may fall to a lesser extent. America and Europe are going on with steady production of crude oil the next 2 quarters crude oil price will remain in the range of 47$- 55$ a barrel.
Stringent Emission Norms
The Indian Ministry of Road Transport & Highways currently implementing Bharat Stage-IV mass emission norms for two-wheeled, three-wheeled and four-wheeled vehicles will be mandatory across the country from April 1, 2017. BS-IV norms for four-wheelers started coming into effect from the year 2010 when it was implemented in select cities. The BS-IV norms, once in place, will ensure that no vehicle, which is not BS-IV, is sold anywhere in the country. The price of the commercial vehicles will be higher than BS- III vehicles. Automotive component manufacturers will have to face the risk of emission norms as OEMs will alter their manufacturing methods. Government encouraging electric vehicles and Euro-6 norms in Eurozone will play a key factor as OEMs have to upgrade their technology. A small commercial vehicle like Tata Ace and Mahindra jeeto with a gross vehicle weight of 1 tonne or less will see a decrease in sales because of the change in emission rules.
Implementation of demonetization
Vehicle sales in the rural markets could be affected in the coming few months by the government’s decision to ban Rs 500 and Rs 1,000 notes, because a big chunk of the market is driven by cash. Across the country the sales has been estimated to be decreased by 50%-60% the impact is more in rural areas than urban. The buying power of the consumer will also get impacted for about 4-5 months since many cash transactions are more in rural areas.. The delay in buying decisions too, will result in a lot of unsold cars being carried forward to next year which will make them cheaper. Domestic sales will be see the sales pressure for the next 2 quarters but in the long term the auto industry will continue to grow as it plays a major role in Indian economy.
Financials
Q2 FY16 Overview
-
The revenues decrease by 20.6 % because of the decrease in demand in US and China markets. Gross profits decreased by 20.1 % and gross margin increased slightly by 0.7%.
-
EBITDA excluding foreign exchange impact decreased by 20.1 % and EBITDA margin increased by 0.7. EBITDA including foreign exchange impact decreased by 18.2% and EBITDA margin decreased by 0.65%.
-
Net profit decreased by 26.3% and net profit margin was decreased by 7.2%.
-
The EPS decreased from 7.4Rs to 5.45Rs shrunk by (26.4%) the last 3 quarters company has been under pressure with the global economy improving it is expected to perform well.
Q2FY16 (in cr)
|
|
Q2 2016 |
Q2 2015 |
VAR[%] |
Q1 2016 |
Q1 2015 |
VAR[%] |
|
Gross Sales |
917.3 |
1146 |
-20 |
941.37 |
1161.1 |
-18.9 |
|
Excise Duty |
45.02 |
47.09 |
-4.4 |
52.61 |
47.23 |
11.4 |
|
Net Sales |
872.28 |
1098.91 |
-20.6 |
888.76 |
1113.87 |
-20.2 |
|
Other Operating Income |
18.61 |
24.97 |
-25.5 |
15.66 |
24.96 |
-37.3 |
|
Other Income |
30.91 |
28.17 |
9.7 |
25.64 |
29.91 |
-14.3 |
|
Total Income |
921.8 |
1152.05 |
-20 |
930.06 |
1168.74 |
-20.4 |
|
Total Expenditure |
643.22 |
803.44 |
-19.9 |
660.01 |
782.25 |
-15.6 |
|
PBIDT |
278.58 |
348.61 |
-20.1 |
270.05 |
386.49 |
-30.1 |
|
Interest |
18.94 |
22.23 |
-14.8 |
17.02 |
21.29 |
-20.1 |
|
PBDT |
259.64 |
326.38 |
-20.4 |
253.03 |
365.2 |
-30.7 |
|
Depreciation |
72.61 |
71.38 |
1.7 |
73.96 |
74.85 |
-1.2 |
|
PBT |
187.03 |
255 |
-26.7 |
179.07 |
290.35 |
-38.3 |
|
Tax |
60.14 |
82.73 |
-27.3 |
57.01 |
94.38 |
-39.6 |
|
Fringe Benefit Tax |
0 |
0 |
0 |
0 |
0 |
0 |
|
Deferred Tax |
0 |
0 |
0 |
0 |
0 |
0 |
|
Reported Profit After Tax |
126.89 |
172.27 |
-26.3 |
122.06 |
195.97 |
-37.7 |
|
Extra-ordinary Items |
0 |
0 |
0 |
0 |
0 |
0 |
|
Adjusted Profit After Extra-ordinary |
126.89 |
172.27 |
-26.3 |
122.06 |
195.97 |
-37.7 |
|
item |
|
|
|
|
|
|
|
|
|
|
|
|
|
|
|
PBIDTM(%) |
31.94 |
31.72 |
0.7 |
30.39 |
34.7 |
-12.4 |
|
PBDTM(%) |
29.77 |
29.7 |
0.2 |
28.47 |
32.79 |
-13.2 |
|
PATM(%) |
14.55 |
15.68 |
-7.2 |
13.73 |
17.59 |
-21.9 |
Balance Sheet as per rough estimates (in cr)
|
BALANCE SHEET (Curr: Rs in Cr.) |
|
|
|
|
|
|
|
|
|
2014 |
2015 |
2016 |
2017 |
2018 |
2019 |
2020 |
|
SOURCES OF FUNDS : |
|
|
|
|
|
|
|
|
Share Capital |
46.57 |
46.57 |
46.57 |
46.57 |
46.57 |
46.57 |
46.57 |
|
Reserves Total |
3593.89 |
3449.11 |
2646.74 |
2870.39 |
3171.7804 |
3539.71 |
3978.63 |
|
Equity Share Warrants |
0 |
0 |
0 |
0 |
0 |
0 |
0 |
|
Equity Application Money |
0 |
0 |
0 |
0 |
0 |
0 |
0 |
|
Total Shareholders Funds |
3640.46 |
3495.68 |
2693.31 |
2916.96 |
3218.3504 |
3586.28 |
4025.20 |
|
NON CURRENT LIABILITIES |
|
|
|
|
|
|
|
|
Secured Loans |
184.11 |
|
757.09 |
804.03 |
878 |
970.19 |
1080.79 |
|
Unsecured Loans |
1656.5 |
|
1237.23 |
1307.13 |
1396.28 |
1502.26 |
1626.945 |
|
Total Debt |
1840.61 |
|
1994.32 |
2111.16 |
2274.28 |
2472.45 |
2707.74 |
|
Other Liabilities |
82.75 |
|
30.79 |
31.84 |
33.37 |
35.13 |
37.31 |
|
|
|
|
|
|
|
|
|
|
Total Liabilities |
5563.82 |
5318.89 |
4718.42 |
5059.96 |
5526.00 |
6093.86 |
6770.25 |
|
|
|
|
|
|
|
|
|
|
APPLICATION OF FUNDS : |
|
|
|
|
|
|
|
|
Net Block |
2167.34 |
1956.09 |
2025.43 |
2094.29 |
2194.82 |
2308.95 |
2459.03 |
|
Capital Work in Progress |
272.12 |
207.68 |
131.4 |
136.39 |
143.08 |
150.80 |
159.25 |
|
Investments |
1429.82 |
1103.74 |
1340.89 |
1426.71 |
1529.43 |
1656.37 |
1802.13 |
|
|
|
|
|
3657.39 |
3867.33 |
4116.13 |
4420.41 |
|
Current Assets |
2221.72 |
2900.33 |
2022.94 |
2150.39 |
2309.51 |
2501.20 |
2723.81 |
|
Total Current Liabilities |
623.27 |
892.98 |
800.98 |
837.02 |
883.90 |
944.00 |
1011.97 |
|
Net Current Assets |
1598.45 |
2007.35 |
1221.96 |
1313.36 |
1425.62 |
1557.20 |
1711.84 |
|
Net Deferred Tax |
-180.73 |
-163.92 |
-179.1 |
-180.4 |
-181.56 |
-182.17 |
-183.52 |
|
Other Assets |
276.81 |
207.95 |
177.83 |
270.30 |
413.56 |
603.80 |
821.17 |
|
Total Assets |
5563.81 |
5318.89 |
4718.42 |
5059.96 |
5526.00 |
6093.86 |
6770.25 |
|
|
|
|
|
|
|
|
|
|
Contingent Liabilities |
1314.74 |
1482.74 |
980.79 |
1001.39 |
1361.89 |
1425.89 |
1501.47 |
P&L as per rough estimates (in cr)
|
PROFIT AND LOSS -(Curr: Rs in Cr.) |
|
|
|
|
|
|
|
|
|
|
|
|
|
|
|
|
|
|
2014 |
2015 |
2016 |
2017E |
2018E |
2019E |
2020E |
|
INCOME : |
|
|
|
|
|
|
|
|
Net Sales |
3399.27 |
4548.05 |
4305.41 |
4504 |
4749.42 |
5041.87 |
5403.58 |
|
Other Income |
157.86 |
122.8 |
99.87 |
98.23 |
96.15 |
95.36 |
94.57 |
|
Stock Adjustments |
36.75 |
16.03 |
1.74 |
0 |
0 |
0 |
0 |
|
|
|
|
|
|
|
|
|
|
Total Income |
3593.88 |
4686.88 |
4407.02 |
4602.23 |
4845.57 |
5137.23 |
5498.15 |
|
|
|
|
|
|
|
|
|
|
EXPENDITURE : |
|
|
|
|
|
|
|
|
Raw Materials |
1410.55 |
1755.86 |
1528.66 |
1,640.72 |
1,775.48 |
1,929.23 |
2,107.88 |
|
Power & Fuel Cost |
316.43 |
353.2 |
312.32 |
322.94 |
333.92 |
345.27 |
357.01 |
|
Employee Cost |
278.85 |
331.93 |
372.16 |
385.19 |
398.67 |
412.62 |
427.06 |
|
Other Manufacturing Expenses |
296.11 |
390.91 |
356.16 |
364.71 |
373.46 |
382.42 |
391.60 |
|
Selling and Administration Expenses |
134.63 |
196.79 |
213.55 |
218.68 |
223.92 |
229.30 |
234.80 |
|
Miscellaneous Expenses |
166.59 |
238.53 |
245.5 |
253.60 |
261.97 |
270.62 |
279.55 |
|
Less: Pre-operative Expenses Capitalised |
0 |
0 |
0 |
0 |
0 |
0 |
0 |
|
Total Expenditure |
2603.16 |
3267.22 |
3028.35 |
3,185.82 |
3,367.42 |
3,569.46 |
3,797.91 |
|
|
|
|
|
|
|
|
|
|
Operating Profit |
990.73 |
1419.67 |
1378.67 |
1416.40 |
1478.16 |
1567.77 |
1700.24 |
|
Interest |
149.57 |
111.84 |
86.32 |
96.32 |
100.51 |
106.61 |
115.62 |
|
Gross Profit |
841.16 |
1307.83 |
1292.35 |
1320.09 |
1377.64 |
1461.16 |
1584.63 |
|
Depreciation |
245.32 |
250.51 |
261.38 |
264.78 |
268.39 |
270.54 |
272.68 |
|
Profit Before Tax |
595.84 |
1057.32 |
1030.97 |
1055.31 |
1109.25 |
1190.62 |
1311.95 |
|
Tax |
153.24 |
340.7 |
313.09 |
738.72 |
776.48 |
833.43 |
918.36 |
|
Fringe Benefit tax |
0 |
0 |
0 |
0 |
0 |
0 |
0 |
|
Deferred Tax |
42.67 |
-2.36 |
16.83 |
17.37 |
17.99 |
18.70 |
19.48 |
|
Reported Net Profit |
399.93 |
718.98 |
701.06 |
721.35 |
758.48 |
814.74 |
898.88 |
|
Extraordinary Items |
11.73 |
2.84 |
-1.06 |
0 |
0 |
0 |
0 |
|
Adjusted Net Profit |
388.2 |
716.14 |
702.12 |
721.35 |
758.48 |
814.74 |
898.88 |
|
|
|
|
|
|
|
|
|
|
Equity Dividend % |
225 |
375 |
375 |
|
|
|
|
|
Dividend Per Share(Rs) |
4.5 |
7.5 |
7.5 |
|
|
|
|
|
Earnings Per Share(Adj)-Unit Curr |
16.41 |
29.36 |
28.58 |
|
|
|
|
Cash Flow Statement ( in cr)
|
Cash Flow (Curr: Rs in Cr.) |
|
|
|
|
|
|
|
2012 |
2013 |
2014 |
2015 |
2016 |
|
Cash Flow Summary |
|
|
|
|
|
|
Cash and Cash Equivalents at Beginning of the year |
12.07 |
105.99 |
132.19 |
75.4 |
316.04 |
|
Net Cash from Operating Activities |
671.53 |
524.74 |
765.26 |
902.71 |
1046.6 |
|
Net Cash Used in Investing Activities |
-735.39 |
20.91 |
-424.67 |
-138.13 |
-602.02 |
|
Net Cash Used in Financing Activities |
157.78 |
-519.45 |
-397.39 |
-523.93 |
-463.89 |
|
Net Inc/(Dec) in Cash and Cash Equivalent |
93.92 |
26.2 |
-56.8 |
240.65 |
-19.29 |
|
Cash and Cash Equivalents at End of the year |
105.99 |
132.19 |
75.39 |
316.04 |
296.75 |
Conclusion and Recommendation
We are positive on Bharat forge Ltd over the long term and hence recommend a BUY at CMP of RS.935 and further add on declines between Rs.900 to Rs.930 for a target of Rs.1251 to Rs.1267 with stop loss maintained at Rs.885.
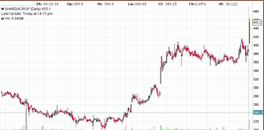
Technical Chart
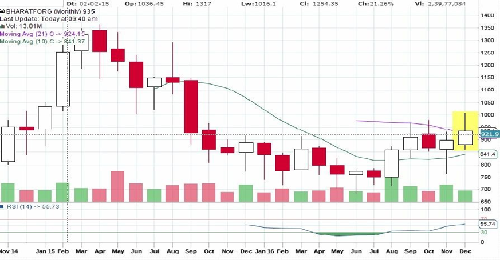
- Share :


Post a Comment
|
DISCLAIMER |
This report is only for the information of our customers. Recommendations, opinions, or suggestions are given with the understanding that readers acting on this information assume all risks involved. The information provided herein is not to be construed as an offer to buy or sell securities of any kind. ATS and/or its group companies do not as assume any responsibility or liability resulting from the use of such information.