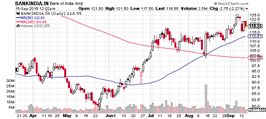
Bank of India
Bank of India provides banking & financial services. Its services include cash management, forex, treasury products, trade finance, deposits, retail banking, and third-party products. The bank has 4,952 branches in India.
|
BSE |
532149 |
|
NSE |
BANKINDIA |
|
REUTERS |
BIO.CO |
|
INCEPTION |
1906 |
|
IPO |
1997 |
|
INDUSTRY |
BANKS – PUBLIC SECTOR |
|
CMP (as on 6/11/2015) |
119.15 |
|
Stock Beta |
1.52 |
|
52 Week H/L |
78.40 – 149.00 |
|
Market Cap (Cr) |
12577 |
|
Equity Capital (cr) |
1054.70 |
|
|
4.41M |
|
Face Value (Rs) |
10 |
|
Average Volume |
|
|
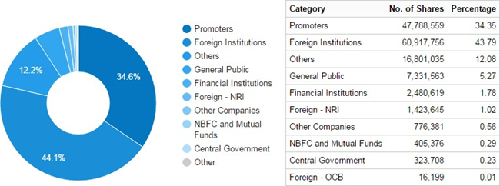
Shareholding Pattern (%) |
|
|
Promoters |
73.72 |
|
Non Institutions |
26.28 |
|
Grand Total |
100.00 |
Bank of India - Recommendation
-
High slippage due to BoI’s conservative approach on recognizing NPAs, despite most loans being under consortium‐lending arrangements.
-
No major improvement is expected on margins
-
Asset quality pressures get aggravated, no respite seen in the near term
Weak asset quality continues to put pressure on growth and profitability for the bank. Maintain NEUTRAL with a target price of Rs 140.
Bank of India - Financial Summary
|
Income Statement As on 15/09/2016 |
2013 |
2014 |
2015 |
2016 |
|
Total Income |
35880.42 |
42444.18 |
47962.95 |
45764.46 |
|
Total Expenditure |
33139.24 |
39711.54 |
46214.61 |
52099.43 |
|
Adjusted Net Profit |
2819.69 |
2986.73 |
2012.9 |
-6204.66 |
|
EPS |
45.58 |
45.6 |
29.23 |
0 |
|
Key Ratios |
||||
|
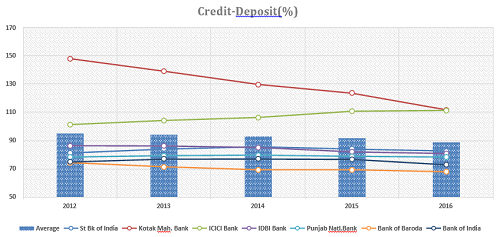
Credit-Deposit (%) |
76.92 |
76.97 |
76.7 |
72.91 |
|
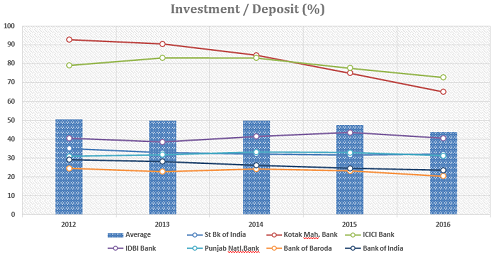
Investment / Deposit (%) |
26.25 |
24.7 |
23.66 |
23.41 |
|
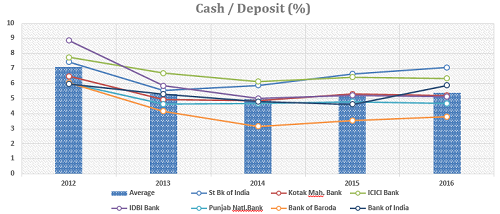
Cash / Deposit (%) |
5.3 |
4.81 |
4.62 |
5.88 |
|
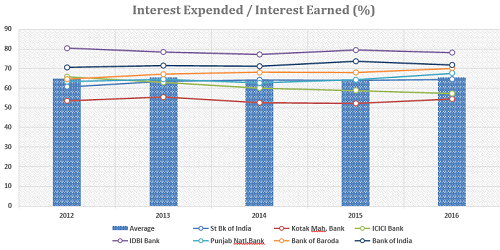
Interest Expended / Interest Earned (%) |
71.54 |
71.26 |
73.76 |
71.85 |
|
Other Income / Total Income (%) |
10.55 |
10.18 |
8.92 |
8.02 |
|
Operating Expenses / Total Income (%) |
15.21 |
16.08 |
17.08 |
20.59 |
|
Interest Income / Total Funds (%) |
7.63 |
7.41 |
7.31 |
6.8 |
|
Interest Expended / Total Funds (%) |
5.46 |
5.28 |
5.39 |
4.89 |
|
Profit before Provisions / Total Funds (%) |
1.77 |
1.64 |
1.26 |
0.98 |
|
Net Profit / Total funds (%) |
0.65 |
0.53 |
0.29 |
-1.02 |
|
RONW (%) |
12.57 |
10.85 |
6.24 |
0 |
|
Pay-out (%) |
22.6 |
12 |
19.79 |
0 |
BUSINESS DESCRIPTION
Bank of Baroda is engaged in providing various services, such as personal banking, corporate banking, international banking, small and medium enterprise (SME) banking, rural banking, non-resident Indian (NRI) services, and treasury services. The Bank's segments include Treasury, Corporate/Wholesale Banking, Retail Banking, and Other Banking Operations. The Bank offers personal banking services, such as deposits, loans, mobile banking and wealth management services; business banking services, such as Baroda Money Express, debit cards, and collection services; corporate banking services, such as appraisal and merchant banking, and cash management and remittances; international banking services, such as export, import, and trade finance, and correspondent banking; rural banking services, such as deposits, priority sector advances, financial inclusion and lockers, and treasury services, such as domestic and forex operations. The Bank operates a network of approximately 5,330 branches.
Bank of India, incorporated in the year 1906, is a Large Cap company (having a market cap of Rs 11,320.5 Cr.) operating in the Banks sector.
Bank of India key Products/Revenue Segments include
-
Interest & Discount on Advances & Bills which contributed Rs 30370.90 Cr to Interest Income (72.66% of Total Interest Income)
-
Income From Investment which contributed Rs 8952.13 Cr to Interest Income (21.41% of Total Interest Income)
-
Interest On Balances with RBI and Other Inter-Bank Funds which contributed Rs 2120.94 Cr to Interest Income (5.07% of Total Interest Income)
-
The interest which contributed Rs 352.49 Cr to Interest Income (0.84% of Total Interest Income)
for the year ending 31-Mar-2016.
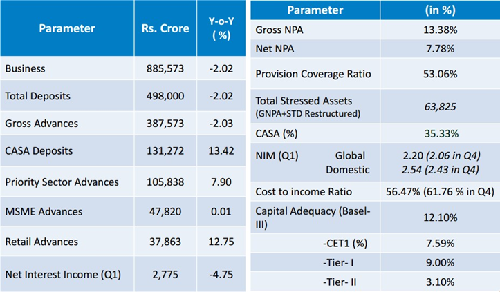
The Bank has reported a Gross Non Performing Assets (Gross NPAs) of Rs 51874.50 Cr. (13.38% of total assets) and Net Non-Performing Assets (Net NPAs) of Rs 28260.40 Cr. (7.78% of total assets).
MANAGEMENT & GOVERNANCE
|
Name |
Designation |
|
R L Bishnoi |
Director(PartTime NonOfficial) |
|
Harvinder Singh |
Director (Officer Employee) |
|
Neeraj Bhatia |
Director (Shareholder) |
|
SANJIV KUMAR ARORA |
Director (Shareholder) |
|
R P Marathe |
Executive Director |
|
R A Sankara Narayanan |
Executive Director |
|
Melwyn Oswald Rego |
Managing Director & CEO |
|
Gopalaraman Padmanabhan |
Chairman (Non-Executive) |
|
Rajeev Bhatia |
Company Secretary |
|
R Sebastian |
Nominee (RBI) |
|
Girish Chandra Murmu |
Nominee (Govt) |
|
Veni Thapar |
Director(PartTime NonOfficial) |
Shareholding pattern as on Sept, 2016
Recent Development
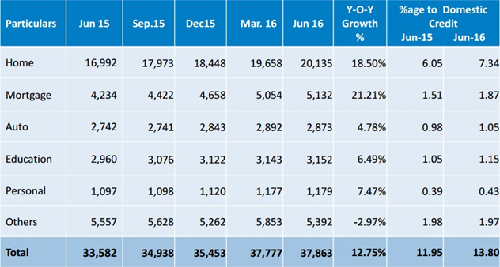
-
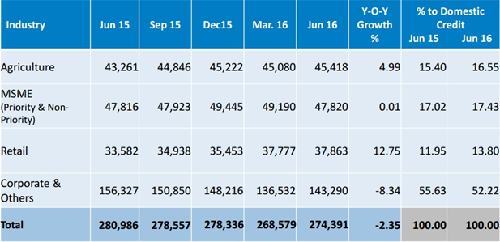
Home loans and mortgage loans (occupying 67% of the retail loan book, 9% of total advances) grew 18.5% YoY and 21.2% YoY respectively. The overall retail book expanded 12.75% while corporate loans de-grew 8.34% YoY
-
The management has guided for a blended growth in CASA deposits at 19% for FY17
-
Loan mix targeted at 45:55 between corporate and retail (currently 55:45)
-
The bank is in the process of recovery with there being a conscious strategy to consolidate the balance sheet, leading to muted loan growth
-
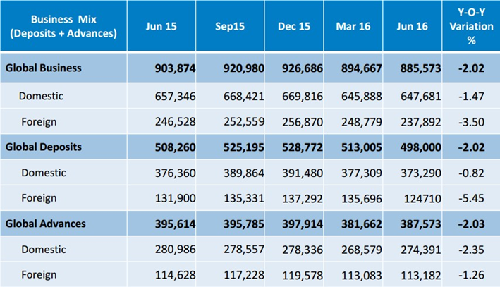
Loan growth for FY17 to be at 6-8%; International loan book to reduce by 9%, Domestic book to increase by at least 12%.
Recoveries/up gradations were at INR31.8b (highest ever); the bank has guided for better run-rate for the rest of the year and see cumulative print at INR175b for FY17. Treasury Income stood at the level of Rs 1312.96 crores in Q1 of FY17. The increase in income provided support to both interest and Non-Interest Income. Total size of Bank’s Domestic Investment as on 30th June, 2016 stood at Rs.1,05,775 crore.
As on 30th June, 2016, the share of SLR-Securities in Total Investment is 85.53 %. The bank had 83.89 % of SLR-Securities in HTM and 16.11 % in AFS as on 30th June, 2016. The percent of SLR to NDTL as on 30th June, 2016 was at 23.31 %. The bank shifted SLR Securities worth Rs. 13,854.96 crore from HTM to AFS portfolio during FY17.
As on 30th June, 2016,the modified duration of AFS investment was 3.98 and that of HTM securities was 4.84 .
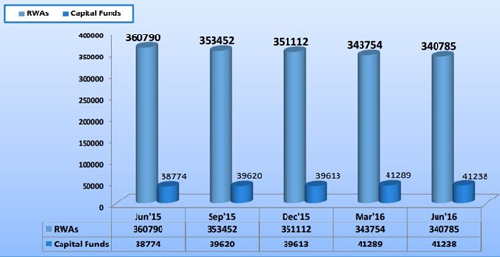
Bank has undertaken various Capital Optimization measures and could conserve RWA of Rs.21,335 crores and Capital of Rs.2,377 crores during FY 2015-16 and for Q1 FY 2016-17, RWA of Rs.4,181 crores and Capital of Rs.501 crores were conserved.
|
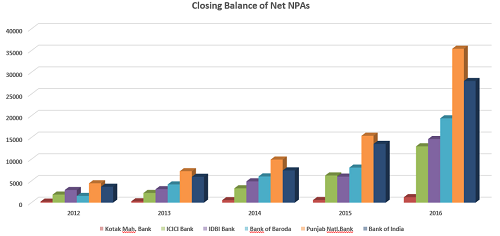
Closing Balance of Net NPAs |
|||||
|
Co_Name |
2012 |
2013 |
2014 |
2015 |
2016 |
|
St Bk of India |
15819 |
21956 |
31096 |
27591 |
55807 |
|
Kotak Mah. Bank |
237 |
311 |
574 |
609 |
1262 |
|
ICICI Bank |
1861 |
2231 |
3298 |
6256 |
12963 |
|
IDBI Bank |
2911 |
3100 |
4902 |
5993 |
14643 |
|
Bank of Baroda |
1544 |
4192 |
6035 |
8069 |
19406 |
|
Punjab Natl.Bank |
4454 |
7237 |
9917 |
15397 |
35423 |
|
Bank of India |
3656 |
5947 |
7417 |
13518 |
27996 |
|
Co_Name |
Credit-Deposit (%) |
||||
|
2012 |
2013 |
2014 |
2015 |
2016 |
|
|
St Bk of India |
81 |
84 |
86 |
84 |
83 |
|
Kotak Mah. Bank |
148 |
139 |
130 |
124 |
112 |
|
ICICI Bank |
101 |
104 |
106 |
111 |
111 |
|
IDBI Bank |
86 |
86 |
85 |
82 |
81 |
|
Punjab Natl.Bank |
78 |
79 |
80 |
79 |
78 |
|
Bank of Baroda |
74 |
71 |
69 |
69 |
68 |
|
Bank of India |
75 |
77 |
77 |
77 |
73 |
|
Average |
95 |
94 |
93 |
91 |
89 |
|
Co_Name |
Investment / Deposit (%) |
||||
|
2012 |
2013 |
2014 |
2015 |
2016 |
|
|
St Bk of India |
35 |
33 |
32 |
32 |
32 |
|
Kotak Mah. Bank |
93 |
90 |
85 |
75 |
65 |
|
ICICI Bank |
79 |
83 |
83 |
78 |
73 |
|
IDBI Bank |
41 |
39 |
41 |
44 |
41 |
|
Punjab Natl.Bank |
31 |
32 |
33 |
33 |
31 |
|
Bank of Baroda |
25 |
23 |
24 |
23 |
20 |
|
Bank of India |
29 |
28 |
26 |
25 |
24 |
|
Average |
51 |
50 |
50 |
47 |
44 |
|
Co_Name |
Cash / Deposit (%) |
||||
|
2012 |
2013 |
2014 |
2015 |
2016 |
|
|
St Bk of India |
7 |
6 |
6 |
7 |
7 |
|
Kotak Mah. Bank |
7 |
5 |
5 |
5 |
5 |
|
ICICI Bank |
8 |
7 |
6 |
6 |
6 |
|
IDBI Bank |
9 |
6 |
5 |
5 |
5 |
|
Punjab Natl.Bank |
6 |
5 |
5 |
5 |
5 |
|
Bank of Baroda |
6 |
4 |
3 |
4 |
4 |
|
Bank of India |
6 |
5 |
5 |
5 |
6 |
|
Average |
7 |
5 |
5 |
5 |
5 |
|
Co_Name |
Interest Expended / Interest Earned (%) |
||||
|
2012 |
2013 |
2014 |
2015 |
2016 |
|
|
St Bk of India |
61 |
64 |
64 |
64 |
64 |
|
Kotak Mah. Bank |
54 |
56 |
53 |
52 |
55 |
|
ICICI Bank |
66 |
63 |
60 |
59 |
57 |
|
IDBI Bank |
80 |
78 |
77 |
79 |
78 |
|
Punjab Natl.Bank |
63 |
65 |
63 |
64 |
68 |
|
Bank of Baroda |
65 |
67 |
68 |
68 |
70 |
|
Bank of India |
71 |
72 |
71 |
74 |
72 |
|
Average |
65 |
65 |
64 |
64 |
65 |
VALUATION
Weak asset quality continues to put pressure on growth and profitability for the bank. Maintain Neutral with a target price of Rs 140.
Dividend History

Industry Overview
The government has cut prevailing interest rates on small savings instruments by 60‐130bps, to bring them in line with market rates. This is a welcome move from a bank’s perspective, as the interest rate differential between bank deposits and some small savings instruments was as high as 170bps (without even factoring tax benefit in schemes such as PPF). Banks have been clamoring for a recalibration of this rate for a while now.
The narrowing differential could provide banks elbow room to cut their deposit rates further. State Bank of India’s one‐year term deposit rate is 7.25%; the lowest it had gone down to (in recent history) was 6% (between November 2009 and March 2010). The interest rate offered by SBI in 1 year deposit is higher than post office 1 yr deposit product. This provides headroom for banks to cut interest in 1 year deposit product. The declining cost of deposits augurs well for SBI’s net‐interest margin, which has been under pressure due to poor credit demand and rising non‐performing loans. The benefit of the decline in deposit rates will be transmitted to borrower under MCLR (marginal cost of fund‐based lending rate).
We believe that banks’ one‐year term deposit rates might see cuts, thereby placing them in better positions to provide short‐term funds to corporate at more competitive rates. Corporates have shifted to the commercial‐paper (CP) market due to the rising rate differential. CP (outstanding Rs 3.56tn) is likely to come back to banks once MCLR kicks in, which bodes well for their loan book growths. Assuming that most of the commercial paper shifts to banks in the form of loans, their loan books could see additional growths of 4‐5%.
Declining inflation and reduction in deposit rates provides additional scope for rate cuts by the policy maker. We expect some rally in the bond market as well. NBFCs and HFCs would benefit from further softening of interest rates in the capital market – MMFS, Cholamandalam Finance, and LIC HF.
FINANCIALS
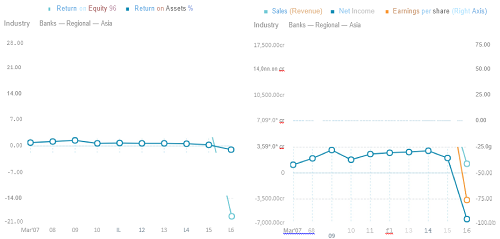
For the quarter ended 30-Jun-2016, the company has reported a Standalone Interest Income of Rs. 6737.27 Cr., down - 8.15% from last quarter Interest Income of Rs. 7335.30 Cr. and down -16.04% from last year's same quarter Interest Income of Rs. 8024.32 Cr. The company has reported a net profit after tax of Rs. -741.36 Cr. in the latest quarter.
The company has M M Nissim & Co. as its auditors. As of 08-Sep-2016, the company has a total of 1,054,695,104 shares outstanding.
Performance at a Glance
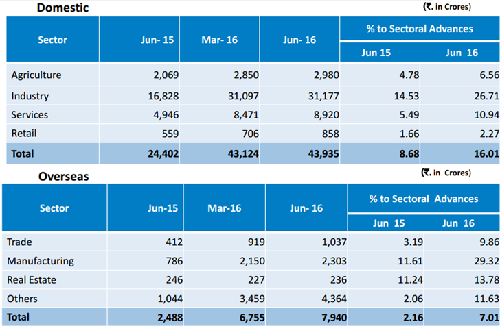
Business -Sequential
Key Sectors – Domestic Credit
Retail Credit
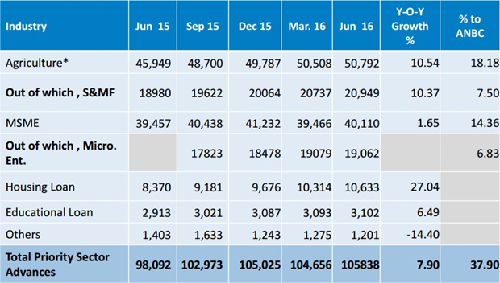
Priority Sector Advances
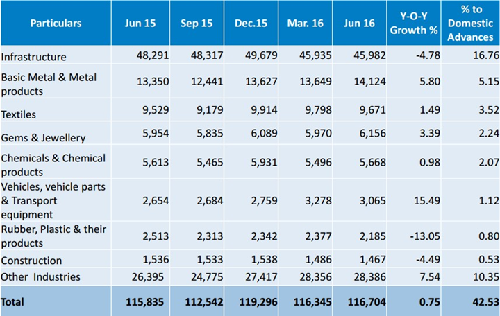
Domestic Credit- Industry Wise
Sector-wise NPA
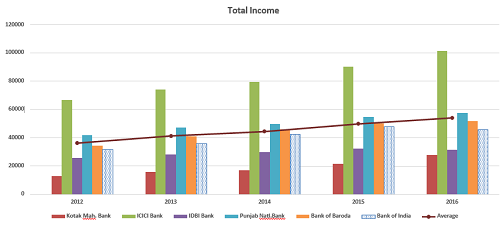
|
CO_NAME |
Total Income |
||||
|
2012 |
2013 |
2014 |
2015 |
2016 |
|
|
Kotak Mah. Bank |
13014 |
15950 |
17268 |
21471 |
28032 |
|
ICICI Bank |
66658 |
74204 |
79564 |
90216 |
101396 |
|
IDBI Bank |
25586 |
28410 |
29720 |
32354 |
31576 |
|
Punjab Natl.Bank |
41735 |
47380 |
49668 |
54884 |
57780 |
|
Bank of Baroda |
34589 |
40953 |
46018 |
50364 |
51791 |
|
Bank of India |
31930 |
35880 |
42444 |
47963 |
45764 |
|
Average |
36316 |
41379 |
44448 |
49858 |
54115 |
|
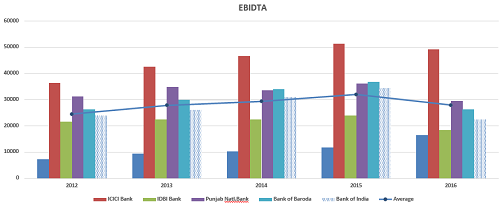
|
EBITDA |
||||
|
2012 |
2013 |
2014 |
2015 |
2016 |
|
|
Kotak Mah. Bank |
7363 |
9348 |
10215 |
11753 |
16491 |
|
ICICI Bank |
36365 |
42521 |
46711 |
51450 |
49144 |
|
IDBI Bank |
21572 |
22477 |
22494 |
23930 |
18512 |
|
Punjab Natl.Bank |
31263 |
34924 |
33556 |
36124 |
29451 |
|
Bank of Baroda |
26324 |
30003 |
33969 |
36898 |
26400 |
|
Bank of India |
23977 |
26166 |
30971 |
34363 |
22499 |
|
Average |
24577 |
27855 |
29389 |
32031 |
28000 |
|
|
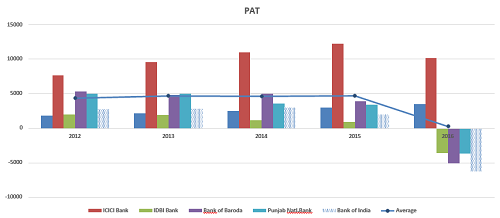
PAT |
||||
|
2012 |
2013 |
2014 |
2015 |
2016 |
|
|
Kotak Mah. Bank |
1833 |
2187 |
2464 |
3035 |
3456 |
|
ICICI Bank |
7646 |
9578 |
10944 |
12245 |
10166 |
|
IDBI Bank |
2001 |
1889 |
1153 |
942 |
-3591 |
|
Bank of Baroda |
5289 |
4805 |
5001 |
3912 |
-5070 |
|
Punjab Natl.Bank |
5022 |
4952 |
3614 |
3397 |
-3692 |
|
Bank of India |
2724 |
2820 |
2987 |
2013 |
-6205 |
|
Average |
4358 |
4683 |
4635 |
4706 |
254 |
|
|
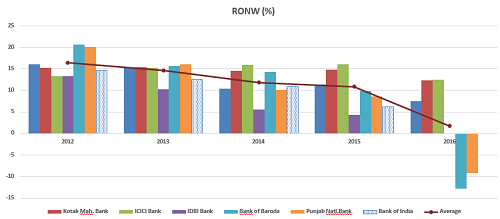
ROW (%) |
||||
|
2012 |
2013 |
2014 |
2015 |
2016 |
|
|
St Bk of India |
16.12 |
15.32 |
10.47 |
11.35 |
7.48 |
|
Kotak Mah. Bank |
15.29 |
15.43 |
14.53 |
14.87 |
12.36 |
|
ICICI Bank |
13.3 |
15.21 |
15.9 |
16.06 |
12.42 |
|
IDBI Bank |
13.31 |
10.29 |
5.63 |
4.29 |
0 |
|
Bank of Baroda |
20.66 |
15.61 |
14.28 |
9.85 |
-12.73 |
|
Punjab Natl.Bank |
20.09 |
16.03 |
10.09 |
8.64 |
-9.2 |
|
Bank of India |
14.61 |
12.57 |
10.85 |
6.24 |
0 |
|
Average |
16.46 |
14.65 |
11.82 |
10.84 |
1.72 |
|
Income Statement As on 15/09/2016 |
2010 |
2011 |
2012 |
2013 |
2014 |
2015 |
2016 |
|
INCOME : |
|
|
|
|
|
|
|
|
Interest/Discount on advances/Bills |
13169.59 |
15569.62 |
20334.08 |
23277.32 |
27298.32 |
31878.18 |
30582.67 |
|
Interest on Balances with RBI & Others |
261.6 |
798.2 |
847.46 |
1278 |
2019.11 |
2174.34 |
2179.22 |
|
Income from Investment |
4489.76 |
5195.2 |
7163.6 |
7287.04 |
8424.41 |
9423.75 |
8976.14 |
|
Others |
75.3 |
295.41 |
265.81 |
253.46 |
383.34 |
208.6 |
354.81 |
|
Interest Earned |
17996.25 |
21858.43 |
28610.95 |
32095.82 |
38125.18 |
43684.87 |
42092.84 |
|
Other Income |
2600.66 |
2641.82 |
3319.24 |
3784.6 |
4319 |
4278.08 |
3671.62 |
|
Total Income |
20596.91 |
24500.25 |
31930.19 |
35880.42 |
42444.18 |
47962.95 |
45764.46 |
|
Expenditure |
|
|
|
|
|
|
|
|
Interest on Deposits |
10853.35 |
12218.45 |
18006.05 |
20313.27 |
23863.51 |
29049.88 |
27097.82 |
|
Interest on RBI/Inter-Bank Borrowings |
555.7 |
812.91 |
1145.34 |
1489.08 |
1839.1 |
1619.41 |
1920.79 |
|
Other Interest |
754.22 |
949.57 |
1064.91 |
1158.06 |
1467.16 |
1550.76 |
1226.7 |
|
Interest expended |
12163.27 |
13980.93 |
20216.3 |
22960.41 |
27169.77 |
32220.05 |
30245.31 |
|
Payments to/Provisions for Employees |
2308.75 |
3492.01 |
3089.51 |
3179.17 |
4036.59 |
5031.3 |
5403.59 |
|
Operating Expenses & Administrative Expenses |
619.77 |
708.48 |
851.37 |
954.19 |
1256.3 |
1370.22 |
1414.23 |
|
Depreciation |
109.96 |
144.86 |
175.05 |
189.07 |
233.9 |
291.08 |
289.96 |
|
Other Expenses, Provisions & Contingencies |
2893.05 |
2669.29 |
4012.21 |
5580.61 |
6180.49 |
7198.54 |
16447.98 |
|
Provision for Tax |
763.55 |
1015.97 |
911.13 |
275.79 |
834.49 |
103.42 |
1471.42 |
|
Deferred Tax |
0 |
0 |
0 |
0 |
0 |
0 |
-3173.06 |
|
Total Expenditure |
18858.35 |
22011.54 |
29255.57 |
33139.24 |
39711.54 |
46214.61 |
52099.43 |
|
Profit & Loss |
|
||||||
|
Net Profit |
1738.56 |
2488.71 |
2674.62 |
2741.18 |
2732.64 |
1748.34 |
-6334.97 |
|
Minority Interest (after tax) |
-2.77 |
5.54 |
8.03 |
-1.79 |
1.35 |
1.89 |
-71.66 |
|
Profit/Loss of Associate Company |
45.83 |
59.25 |
58.27 |
76.92 |
255.48 |
266.47 |
59.05 |
|
Net Profit after Minority Interest & P/L Asso.Co. |
1787.16 |
2542.42 |
2724.86 |
2819.89 |
2986.77 |
2012.92 |
-6204.26 |
|
Extraordinary Items |
0.06 |
0.02 |
0.56 |
0.2 |
0.04 |
0.02 |
0.4 |
|
Adjusted Net Profit |
1787.1 |
2542.4 |
2724.3 |
2819.69 |
2986.73 |
2012.9 |
-6204.66 |
|
Equity Dividend (%) |
70 |
70 |
70 |
100 |
50 |
50 |
0 |
|
Dividend Per Share(Rs) |
7 |
7 |
7 |
10 |
5 |
5 |
0 |
|
EPS |
32.83 |
45.34 |
46.32 |
45.58 |
45.6 |
29.23 |
0 |
|
Book Value (Unit Curr.) |
247.5 |
298.17 |
351.22 |
390.33 |
420.4 |
435.18 |
392.05 |
|
Balance Sheet |
2014 |
2015 |
2016 |
|
SOURCES OF FUNDS : |
|
|
|
|
Capital |
643 |
665.65 |
817.29 |
|
Reserves Total |
30130.72 |
31857.2 |
31224.72 |
|
Equity Share Warrants |
0 |
0 |
0 |
|
Equity Application Money |
0 |
0 |
1303.65 |
|
Minority Interest |
84 |
167.93 |
98 |
|
Deposits |
478695.1 |
534482.3 |
515722.5 |
|
Borrowings |
48427.51 |
40098.69 |
51103.28 |
|
Other Liabilities & Provisions |
20174.29 |
18012.98 |
16359.82 |
|
Policy Holders Fund |
0 |
0 |
0 |
|
Others |
0 |
0 |
0 |
|
TOTAL LIABILITIES |
578154.6 |
625284.8 |
616629.2 |
|
APPLICATION OF FUNDS : |
|
|
|
|
Cash & Balances with RBI |
19287.86 |
27498.39 |
34213.72 |
|
Balances with Banks & money at Call |
42472.45 |
49440.54 |
65291 |
|
Investments |
116489.7 |
123195.5 |
122620.9 |
|
Advances |
372671.5 |
404389.4 |
361301.9 |
|
Fixed Assets |
5820.19 |
5914.49 |
8572.85 |
|
Other Assets |
21412.91 |
14846.46 |
24628.86 |
|
Others |
0 |
0 |
0 |
|
TOTAL ASSETS |
578154.6 |
625284.8 |
616629.2 |
|
Contingent Liability |
252826.4 |
174892 |
354063.4 |
|
Bills for collection |
21862.72 |
26420.18 |
26902.1 |
|
Cash Flow Summary |
2014 |
2015 |
2016 |
|
Cash and Cash Equivalents at Beginning of the year |
76938.92 |
61760.31 |
55377.13 |
|
Net Cash from Operating Activities |
18310.79 |
14638.2 |
6451.62 |
|
Net Cash Used in Investing Activities |
-608.69 |
-754.66 |
-813.88 |
|
Net Cash Used in Financing Activities |
4863.7 |
1295.07 |
745.44 |
|
Net Inc/(Dec) in Cash and Cash Equivalent |
22565.8 |
15178.61 |
6383.18 |
|
Cash and Cash Equivalents at End of the year |
99504.72 |
76938.92 |
61760.31 |
- Share :


Post a Comment
|
DISCLAIMER |
This report is only for the information of our customers. Recommendations, opinions, or suggestions are given with the understanding that readers acting on this information assume all risks involved. The information provided herein is not to be construed as an offer to buy or sell securities of any kind. ATS and/or its group companies do not as assume any responsibility or liability resulting from the use of such information.