Bajaj Auto Limited Research Report
|
Industry |
Market Price |
Recommendation |
Target |
Time Horizon |
|
Automobile |
3,720.75 |
Buy |
4,458 |
1 Year |
Q3 FY 2022 Review
Bajaj Auto Limited reported net revenue of ₹9,021.65 crores for the quarter ended December 31, 2021, compared to ₹8,909.88 crores for December 31, 2020. EBIT and Profit After Tax were ₹1,648.89 crores and ₹1,429.68 crores for the quarter ended, 31, 2021, as compared to ₹2,032.82 crores and ₹1,716.26 crores, during the corresponding quarter of the previous year respectively.
Bajaj Auto Limited - Investment Summary
|
CMP (₹) |
3,720.75 |
|
52 Week H/L |
3,027/4,347 |
|
Market Cap (crores) |
1,07,666 |
|
Face Value (₹) |
10.00 |
|
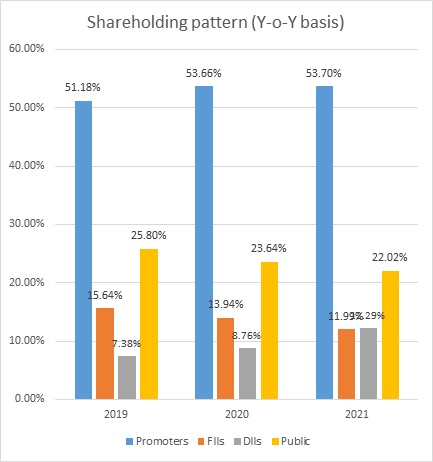
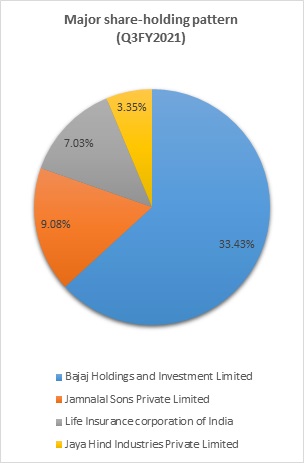
Promoter Holding (%) |
53.73 |
|
Non-Promoter Holding (%) |
46.27 |
|
Total (%) |
100.00 |
|
Book Value |
₹942.51 |
|
EPS TTM |
₹167.90 |
Overview
-
Bajaj Auto Limited sold 38,36,856 units of 2-wheelers and 4,71,577 units of commercial vehicles in FY 2022.
-
The company is the No.1 manufacturer of motorcycles and the third largest manufacturer of 3-wheelers globally.
-
Bajaj Auto International Holdings BV (BAIHBV), a 100% subsidiary of the Company, held a 47.99% stake in KTM AG. As of 29 September 2021, BAIHBV swapped a 46.50% stake in KTM AG for a 49.90% stake in Pierer Bajaj AG.
Beta: 0.71 |
Alpha: -2.92 |
Risk Reward Ratio: 1.34 |
Margin of Safety: 17% |
Bajaj Auto Limited - Quarterly Summary
|
Quarterly (INR in crores) |
Dec-21 |
Sep-21 |
Jun-21 |
Mar-21 |
Dec-20 |
|
Revenue from Operations |
9,022 |
8,762 |
7,386 |
8,596 |
8,910 |
|
Other income |
347.66 |
318.32 |
329.3 |
283.6 |
369.18 |
|
Total Income |
9,369 |
9,081 |
7,715 |
8,880 |
9,279 |
|
|
|
|
|
|
|
|
Total Expenditure |
7720.42 |
7427.84 |
6332.3 |
7140.46 |
7246.24 |
|
EBIT |
1,649 |
1,653 |
1,383 |
1,739 |
2,033 |
|
|
|
|
|
|
|
|
Finance cost |
1.79 |
1.7 |
2.29 |
2.04 |
1.02 |
|
Share of Profits of Associate |
141.26 |
265.26 |
110.96 |
221.5 |
160.96 |
|
EBT before Exceptional Items |
1,788 |
1,916 |
1,492 |
1,959 |
2,193 |
|
|
|
|
|
|
|
|
Exceptional items |
0 |
501.23 |
0 |
0 |
0 |
|
PBT |
1,788 |
2,417 |
1,492 |
1,958.70 |
2,193 |
|
|
|
|
|
|
|
|
Tax Expenses |
358.68 |
377.59 |
321.54 |
407.42 |
476.5 |
|
PAT |
1,429.68 |
2,039.86 |
1,170.17 |
1,551.28 |
1,716.26 |
Business
-
Bajaj Auto Limited is engaged in the business of development, manufacturing, and distribution of automobiles such as motorcycles, commercial vehicles, electric two-wheelers vehicles, etc., and parts thereof.
-
The company sells its products in India as well as in various other global markets
-
The company has sold more than 18 million motorcycles in over 70 countries. It is India’s No.1 motorcycle exporter, with two out of three bikes sold internationally carrying a Bajaj Badge.
-
Bajaj Auto is the first two-wheeler and three-wheeler company in India to have reached a market capitalisation of INR 1 trillion.
-
It has three manufacturing facilities with a total capacity of 6.3 million vehicles per annum.
-
Bajaj Auto Limited's business segments include:
-
Milage Segment:
-
Bajaj Auto is represented by various models of CT, the Platina, and Pulsar 125.
-
It is the largest segment and is an extremely price and fuel cost-conscious segment and generates marginal profits per unit sold.
-
-
Sports Segment:
-
The company has five models of Pulsar, ranging from 150cc to 220cc, and two variants of the Avengers
-
-
Super Sports Segment:
-
The company offers the entire range of KTMs, Husqvarnas, Pulsar RS200 and Dominars.
-
-
Scooters Segment:
-
The company has re-introduced the legendary brand ‘Chetak’ as a best-in-class electric scooter.
-
It offers a ride up to 95 Km in the Eco mode per single charge of its battery.
-
-
Three-Wheeler segment:
-
It continues to be the dominant exporter among the Indian sellers accounting for a market share of 64.7% in FY 2021, up from 59.1% in FY2020
-
-
-
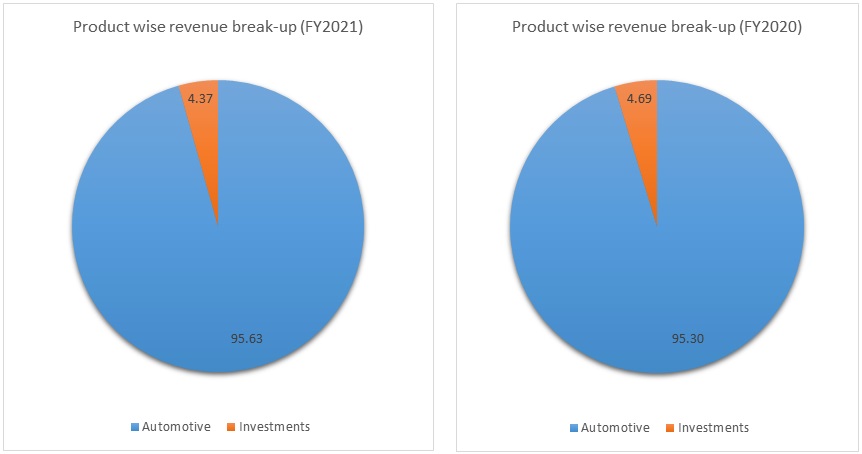
Out of the total revenue, 95.63% has been generated from Automotive and 4.37% from others in FY 2021, compared to 95.30% and 4.69% in FY 2020, respectively.
-
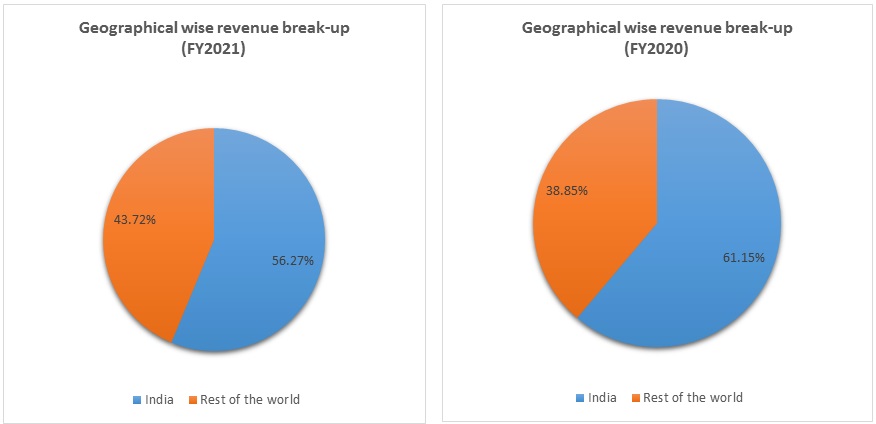
Out of the total revenue, 56.27% has been generated from India and 43.72% from outside India in FY 2021, compared to 61.15% and 38.85% in FY 2020, respectively.
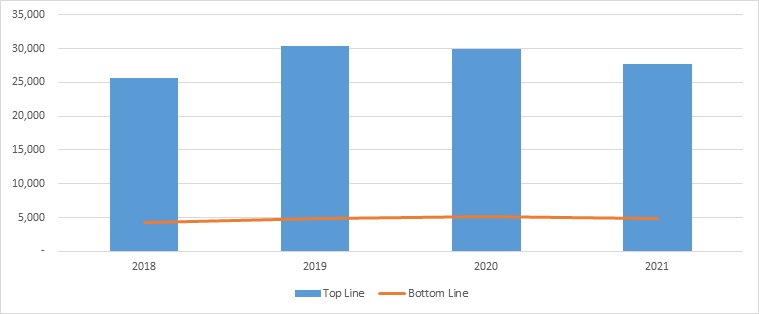
Revenue Trend
Topline and Bottomline trend (crores)
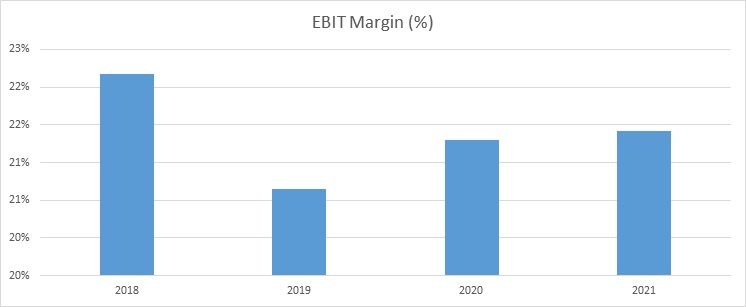
Ratio Analysis
|
|
Mar-18 |
Mar-19 |
Mar-20 |
Mar-21 |
|
Profitability Ratio |
|
|
|
|
|
Gross Profit |
36.56% |
32.63% |
34.88% |
33.91% |
|
EBITDA Margin |
23.40% |
21.52% |
22.13% |
22.35% |
|
EBIT Margin |
22.17% |
20.65% |
21.30% |
21.42% |
|
Pre-Tax Margin |
23.29% |
21.79% |
22.37% |
22.50% |
|
Net Profit Margin |
16.47% |
16.23% |
17.42% |
17.51% |
|
|
||||
|
Return on Investment |
||||
|
Return on Asset – ROA |
19.05% |
18.09% |
16.99% |
18.67% |
|
Return on Capital Employed – ROCE |
28.79% |
27.87% |
27.58% |
23.67% |
|
Return on Equity – ROE |
23.28% |
22.37% |
20.95% |
22.93% |
|
|
||||
|
Liquidity Ratio |
||||
|
Current ratio (x) |
2.25 |
1.45 |
1.56 |
2.51 |
|
Quick Ratio |
2.07 |
1.25 |
1.31 |
2.25 |
|
|
||||
|
Turnover Ratio |
||||
|
Receivables Turnover |
20.95 |
14.99 |
13.97 |
12.49 |
|
Inventory Turnover |
23.67 |
25.58 |
20.75 |
15.34 |
|
Payables Turnover |
6.37 |
6.20 |
6.03 |
5.13 |
|
Asset Turnover |
1.10 |
1.12 |
1.08 |
0.92 |
|
|
||||
|
Solvency Ratio |
||||
|
Debt to Equity |
0 |
0 |
0 |
0 |
Bajaj Auto Limited - Financial Overview
Bajaj Auto Limited - Profit and Loss Statement (₹ in crores)
|
|
Mar-18 |
Mar-19 |
Mar-20 |
Mar-21 |
|
Revenue |
25,617 |
30,358 |
29,919 |
27,741 |
|
Other income |
1,158.26 |
1,344.49 |
1,524.57 |
1,276.46 |
|
Total Revenue |
26,776 |
31,702 |
31,443 |
29,018 |
|
|
|
|
|
|
|
Cost of Goods Sold |
17,410 |
21,798 |
21,008 |
19,610 |
|
Gross Profit |
9,365 |
9,904 |
10,435 |
9,408 |
|
|
|
|
|
|
|
Excise Duty |
398.34 |
- |
- |
- |
|
Employee benefit expense |
1,069 |
1,257 |
1,391 |
1,288 |
|
Other Expenses |
1,928 |
2,144 |
2,454 |
1,931 |
|
Expenses, included in the above items, capitalised |
-24 |
-30 |
-30 |
-12 |
|
EBITDA |
5,994 |
6,534 |
6,620 |
6,201 |
|
|
|
|
|
|
|
Depreciation and amortisation expenses |
314.80 |
265.69 |
246.43 |
259.37 |
|
EBIT |
5,679.11 |
6,268.31 |
6,373.78 |
5,941.77 |
|
|
|
|
|
|
|
Share of profit of associate |
287.61 |
349.75 |
321.51 |
306.32 |
|
Finance costs |
1.31 |
4.48 |
3.16 |
6.66 |
|
EBT Before exceptional item |
5,965.41 |
6,613.58 |
6,692.13 |
6,241.43 |
|
|
|
|
|
|
|
Exceptional items |
32.00 |
-342.00 |
- |
- |
|
Profit before tax |
5,933.41 |
6,955.58 |
6,692.13 |
6,241.43 |
|
|
|
|
|
|
|
Income Tax Expense |
1,714 |
2,028 |
1,480 |
1,384 |
|
PAT |
4,218.94 |
4,927.60 |
5,211.91 |
4,857.02 |
|
|
|
|
|
|
|
EPS |
|
|
|
|
|
Basic |
145.80 |
170.30 |
180.20 |
167.90 |
|
Diluted |
145.80 |
170.30 |
180.20 |
167.90 |
|
|
|
|
|
|
|
Number of shares |
|
|
|
|
|
Basic |
28.94 |
28.93 |
28.92 |
28.93 |
|
Diluted |
28.94 |
28.93 |
28.92 |
28.93 |
Bajaj Auto Limited - Cash Flow Statement (₹ in crores)
|
|
Mar-18 |
Mar-19 |
Mar-20 |
Mar-21 |
|
Net Profit Before Tax |
5,933 |
6,956 |
6,692 |
6,241 |
|
Net Cash from Operating Activities |
4,328 |
2,487 |
3,850 |
3,120 |
|
Net Cash Used for Investing Activities |
(2,053) |
(338) |
1,556 |
(2,868) |
|
Net Cash From (Used For) Financing Activities |
(1,885) |
(2,074) |
(6,247) |
(20) |
|
Net Increase in Cash and Cash Equivalents |
464 |
167 |
(632) |
232 |
|
Cash And Cash Equivalents at The Beginning of the Year |
288 |
776 |
916 |
285 |
|
Cash And Cash Equivalents at The End of the Year |
776 |
916 |
285 |
517 |
Bajaj Auto Limited - Balance Sheet (₹ in crores)
|
|
Mar-18 |
Mar-19 |
Mar-20 |
Mar-21 |
|
ASSETS |
|
|
|
|
|
Non-Current Assets: |
|
|
|
|
|
Property, Plant & Equipment |
1,821 |
1,689 |
1,602 |
1,568 |
|
Capital WIP |
11 |
12 |
47 |
16 |
|
Investment Property |
57 |
56 |
54 |
52 |
|
Intangible Assets |
- |
20 |
43 |
47 |
|
Intangible Assets Under Development |
45 |
36 |
14 |
- |
|
Investment In Subsidiaries, Association and Joint Venture |
2,529 |
2,666 |
2,951 |
3,289 |
|
Financial Assets: |
||||
|
Investments |
10,600 |
16,360 |
14,183 |
13,370 |
|
Trade Receivables |
- |
- |
- |
- |
|
Loans |
31 |
32 |
32 |
32 |
|
Other Financial Assets |
0 |
0 |
3 |
- |
|
Income Tax Assets (Net) |
439 |
584 |
715 |
715 |
|
Other Non-Current Assets |
357 |
307 |
251 |
325 |
|
Total Non-Current Assets |
15,890 |
21,761 |
19,894 |
19,414 |
|
|
||||
|
Current Assets: |
||||
|
Inventories |
743 |
962 |
1,064 |
1,494 |
|
Financial Assets: |
||||
|
Investments |
5,765 |
1,576 |
2,780 |
8,028 |
|
Trade Receivables |
1,492 |
2,560 |
1,725 |
2,717 |
|
Cash and Cash Equivalents |
776 |
916 |
285 |
517 |
|
Other Bank Balances |
17 |
17 |
31 |
22 |
|
Loans |
6 |
6 |
6 |
6 |
|
Other Financial Assets |
79 |
113 |
88 |
224 |
|
Other Current Assets |
373 |
923 |
637 |
1,181 |
|
Total Current Assets |
9,251 |
7,073 |
6,616 |
14,188 |
|
|
||||
|
Total Assets |
25,141 |
28,834 |
26,510 |
33,602 |
|
|
||||
|
EQUITIES & LIABILITIES |
||||
|
Equity |
||||
|
Equity Share Capital |
289 |
289 |
289 |
289 |
|
Other Equity |
20,136 |
22,944 |
21,373 |
26,984 |
|
Equity Attributable to Owners of the Company |
20,425 |
23,234 |
21,662 |
27,273 |
|
|
||||
|
Non-Controlling Interests |
0 |
0 |
0 |
0 |
|
Total Equity |
20,425 |
23,234 |
21,662 |
27,273 |
|
|
||||
|
Liabilities: |
||||
|
Non-Current Liabilities |
||||
|
Financial Liabilities |
||||
|
Sales Tax Deferral |
121 |
125 |
126 |
121 |
|
Provisions |
112 |
15 |
81 |
2 |
|
Deferred Tax Liabilities |
323 |
543 |
346 |
522 |
|
Government Grant |
47 |
44 |
41 |
39 |
|
Other Non-Current Liabilities |
1 |
1 |
1 |
1 |
|
Total Non-Current Liabilities |
604 |
727 |
595 |
685 |
|
|
||||
|
Current Liabilities |
||||
|
Financial Liabilities |
||||
|
Trade payables |
||||
|
Total Outstanding Dues of Micro & Small Enterprises |
1 |
3 |
14 |
121 |
|
Other Creditors |
3,243 |
3,784 |
3,186 |
4,453 |
|
Other Financial Liabilities |
329 |
371 |
548 |
407 |
|
Other Current Liabilities |
394 |
557 |
329 |
483 |
|
Provisions |
126 |
141 |
158 |
152 |
|
Government Grant |
3 |
3 |
3 |
3 |
|
Current Tax Liabilities (Net) |
16 |
16 |
16 |
24 |
|
Total Current Liabilities |
4,111 |
4,874 |
4,253 |
5,644 |
|
|
||||
|
Total Equity and Liabilities |
25,141 |
28,834 |
26,510 |
33,602 |
Industry Overview
-
During FY 2022 total domestic two-wheeler and three-wheeler sales were 1,34,66,412 units and 2,60,995 units, compared to 1,51,19,387 units and 2,16,197 units in FY 2021. Domestic sales were impacted due to a shortage of semiconductors, a hike in raw materials prices, and low demand in rural areas.
-
For the two-wheelers market battling muted retailed sentiments and high ownership costs, the export numbers helped to offset the lower domestic tally. In FY 2022, Two-wheelers exports increased by 35% to 44,43,018 units, compared to the previous year at 32,82,786 units.
Top 5 two-wheelers companies
Export Sales (Units)
Company
FY 2022
FY 2021
Y-o-Y growth (%)
Bajaj Auto
21,95,772
17,96,518
18%
TVS Motors
10,79,893
7,55,726
30%
Hero Moto Corp
2,90,131
1,77,009
39%
India Yamaha Motors
2,71,507
1,89,177
30%
Honda Motors and Scooters India
1,62,943
1,08,690
33%
-
Society of Indian Automobile Manufacturers president Kenichi Ayukawa said, “Two-wheeler achieved their highest ever export. It is good to see Indian products are becoming more acceptable worldwide for their quality, cost, and performance”.
-
Overall, the coming fiscal will have its share of uncertainties, especially with the Ukraine war, which impacts supplies of precious metals and fuel price hikes. Geo-political tension, the severe crisis in Sri Lanka, and the continued headwinds in terms of raw material shortage will remain areas of concern. As the Automakers prepare to future proof business from challenges in the future, it would be interesting to see how exports pan out going forward.
Market share Bajaj Auto Limited
|
Sales of Motor Cycles (Domestic & Exports) |
|||
|
Year |
Industry sales (units) |
Bajaj Auto Sales (units) |
Bajaj Auto Market Share (%) |
|
2018 |
1,50,96,538 |
33,69,334 |
22.32% |
|
2019 |
1,64,65,529 |
42,36,873 |
25.73% |
|
2020 |
1,43,51,159 |
39,47,356 |
27.51% |
|
2021 |
1,30,57,275 |
36,04,498 |
27.61% |
|
|
Sales of Three Wheelers (Domestic & Exports) |
||
|
Year |
Industry sales (units) |
Bajaj Auto Sales (units) |
Bajaj Auto Market Share (%) |
|
2018 |
10,16,700 |
6,35,852 |
62.54% |
|
2019 |
12,68,700 |
7,77,603 |
61.29% |
|
2020 |
11,38,738 |
6,61,517 |
58.09% |
|
2021 |
6,09,138 |
3,63,504 |
59.68% |
Concall Overview (Q3FY2022)
-
The higher raw material prices, semi-conductor shortage, and shipping-related concerns continue to hurt the company’s margin.
-
Bajaj Auto sold 2,000 units of electric chetak in Q3FY2022 with the current order book of 10,000 units. At present, it sells electric chetak in eight cities and plans to expand to 12 more cities.
-
At present, a hike in raw materials prices is passed on to customers.
Bajaj Auto Limited - Technical Analysis
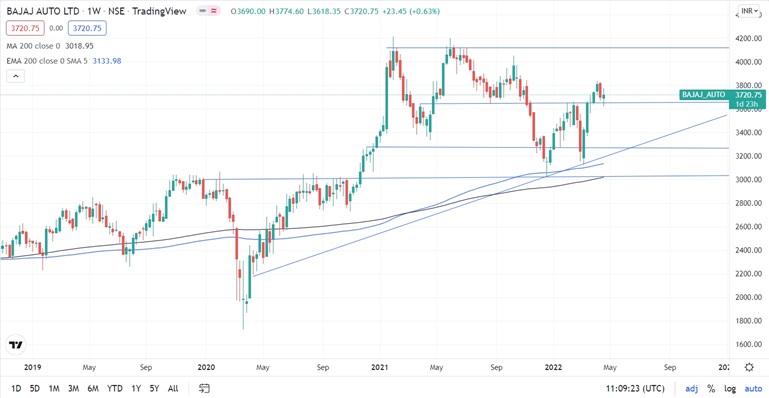
-
Stock is trading above EMA 200 and MA 200 indicators, with a strong support level of ₹3,265 and a resistance level at ₹4,121.
-
Share can consolidate at the current level.
Recommendation Rationale:
-
For the first nine months, Bajaj Auto Limited’s revenue increased by 30.38% to ₹24,407.85 crores, compared to the previous year at ₹18720.10. Profit After Tax increased by 40% to ₹4,639.71 crores compared to the last year at ₹3,305.74 crores. (Note: Net Profit of ₹4,639.71 crores includes an exceptional gain of ₹501.23 crores.)
-
The company has maintained its market position in two-wheelers and three-wheelers in both the domestic and export markets. It caters to around 70 countries all over the world.
-
Overall, the two-wheeler industry’s domestic sales were impacted in FY 2022, but they were offset by export sales, and Bajaj Auto maintained its market position.
-
The company is virtually debt-free.
-
The company’s ROCE and ROE are 23.67% and 22.93%.
-
The market has started producing electric vehicles and has an order book of 10,000 units.
-
Experience management, strong market position, diversified business, and the brand name will help the company to have overall development in terms of business.
Valuation
-
The company’s revenue has increased at a CAGR of 4.70 % from FY 2018-2021
-
The company can mitigate its risk due to a better geographical revenue mix segment. It earns more than 40% of its revenue total revenue from exports.
-
High inflation, shortage of semiconductors, and the Ukraine-Russia war have led to a rise in prices of metals and fuel, which is impacting the automobile sector indirectly. This could put pressure on the profit margin of the automobile sector in Q4FY2022 and Q1FY2023.
-
Based on the current performance of the company in the first nine months, we expect the company could post higher revenue for the current financial (2022), corresponding to the previous year.
-
We have taken data for the last five years (2017-2021) and forecasted revenue for FY 2022-2026. Revenue growth is assumed to be 11%.
Estimated Income Statement (₹ in crores):
|
|
Mar-22 |
Mar-23 |
Mar-24 |
Mar-25 |
Mar-26 |
|
|
2022-E |
2023-E |
2024-E |
2025-E |
2026-E |
|
Revenue |
32,403.91 |
36,054.73 |
40,119.08 |
44,643.98 |
49,681.85 |
|
COGS |
1,301.88 |
1,327.80 |
1,354.23 |
1,381.20 |
1,408.70 |
|
Gross Profit |
33,705.78 |
37,382.53 |
41,473.31 |
46,025.18 |
51,090.55 |
|
Employee Expenses |
1,505.47 |
1,675.09 |
1,863.92 |
2,074.14 |
2,308.20 |
|
Other Expenses |
2,456.60 |
2,733.38 |
3,041.50 |
3,384.55 |
3,766.48 |
|
Expenses, included in above items, capitalised |
-23.40 |
-26.03 |
-28.97 |
-32.23 |
-35.87 |
|
EBITDA |
6,760.33 |
7,401.23 |
8,112.31 |
8,901.50 |
9,777.63 |
|
Depreciation |
258.78 |
266.64 |
278.51 |
294.40 |
314.36 |
|
EBIT |
10,881.52 |
10,881.52 |
10,881.52 |
10,881.52 |
10,881.52 |
|
Financial Cost |
8.12 |
8.91 |
9.78 |
10.75 |
11.82 |
|
EBT |
6,493.44 |
7,125.69 |
7,824.02 |
8,596.35 |
9,451.46 |
|
Tax expenses |
1,623.36 |
1,781.42 |
1,956.00 |
2,149.09 |
2,362.86 |
|
PAT |
4,870.08 |
5,344.27 |
5,868.01 |
6,447.26 |
7,088.59 |
-
We initiate coverage on Bajaj Auto Limited with a “BUY” and a 1-year Target Price of ₹ 4,458.
Disclaimer: This report is only for the information of our customers Recommendations, opinions, or suggestions are given with the understanding that readers acting on this information assume all risks involved. The information provided herein is not to be construed as an offer to buy or sell securities of any kind.
- Share :


Post a Comment
|
DISCLAIMER |
This report is only for the information of our customers. Recommendations, opinions, or suggestions are given with the understanding that readers acting on this information assume all risks involved. The information provided herein is not to be construed as an offer to buy or sell securities of any kind. ATS and/or its group companies do not as assume any responsibility or liability resulting from the use of such information.