Apollo Hospitals
Apollo Hospitals Enterprise Ltd., incorporated in the year 1979, is a Large Cap company operating in the Pharmaceuticals and health care sector.
|
BSE Code |
508869 |
|
NSE Code |
APOLLOHOSP |
|
Reuters Code |
HCLT.NS |
|
CMP (as on 11/09/2015) |
1362.50 |
|
Stock Beta |
0.6782 |
|
52 Week H/L |
1016 / 1478 |
|
Market Cap (Cr) |
1,80,000 |
|
Face Value (Rs) |
5.00 |
|
Average Volume |
1,78,523 |
|
|
|
|
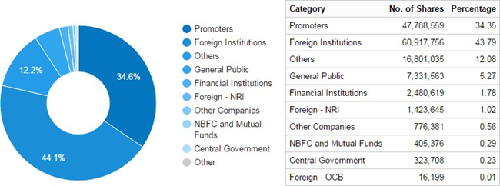
Shareholding Pattern (%) |
|
|
Promoters |
34.35 |
|
Non Institutions |
65.65 |
|
Grand Total |
100.00 |
Apollo Hospitals Enterprise Ltd - Potential Catalysts
-
Robust growth with improvement in margins
-
Favorable environment for Pharma market
-
Revenues to grow at a three-year CAGR of 20% by FY18
-
Geographic presence
Apollo Hospitals Enterprise Ltd - Conclusion & Recommendation
Based on the strong product portfolio and geographically diversified presence, we value the stock at 54x PE, which gives a target price of Rs 1525. We feel that investors could buy the stock at the CMP for the given target prices for a year from now.
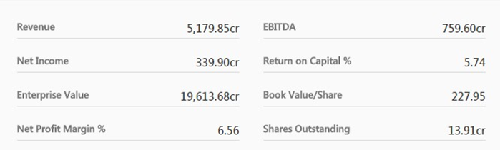
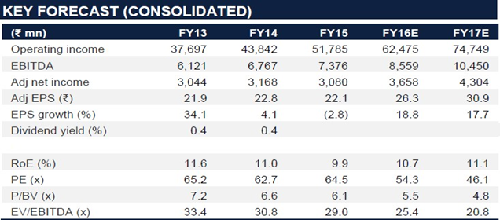
Apollo Hospitals Enterprise Ltd - Financial Summary
|
|
FY 13 |
FY 14 |
FY 15 |
FY 16 E |
FY 17 E |
|
Operating Income |
37697 |
43842 |
51785 |
62475 |
74749 |
|
EBITDA |
6121 |
6767 |
7376 |
8559 |
10450 |
|
Adj Net Income |
3044 |
3168 |
3080 |
3658 |
4350 |
|
Adj EPS |
21.9 |
22.8 |
22.1 |
26.3 |
30.9 |
|
EPS growth |
34.1 |
4.1 |
-2.8 |
18.8 |
17.7 |
|
|
|||||
|
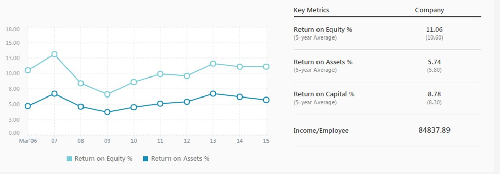
RoE |
11.6 |
11 |
9.9 |
10.7 |
11.1 |
|
PE |
65.2 |
62.7 |
64.5 |
54.3 |
46.1 |
|
P/BV |
7.2 |
6.6 |
6.1 |
5.5 |
4.8 |
|
EV/EBITDA |
33.4 |
30.8 |
29 |
25.4 |
20.8 |
BUSINESS DESCRIPTION
Apollo Hospitals Enterprise, Ltd. is a provider of healthcare services. The Company’s healthcare facilities comprise primary, secondary, and tertiary care facilities. The tertiary care hospitals provide advanced levels of care in over 50 specialties, including cardiac sciences, oncology, neurosciences, critical care, orthopedics, radiology, gastroenterology, and transplants. In addition, it is focused on technology-based treatment areas such as minimally invasive surgery, robotics and technology for cancer. Apollo Hospitals operates over 8,617 beds across 50 hospitals, 1,632 pharmacies, over 100 primary care, and diagnostic clinics, 115 telemedicine units across 10 countries, 15 academic institutions, and a research foundation with a focus on global clinical trials, epidemiological studies, stem-cell and genetic research. It also operates retail healthcare centers including dental clinics and lifestyle birthing centers. It also offers health insurance services and projects consultancy.
MANAGEMENT & GOVERNANCE
Apollo Hospital company’s management includes Mrs.Suneeta Reddy, Dr.Prathap C Reddy, Mr.Deepak Vaidya, Mr.G Venkatraman, Mr.Habibullah Badsha, Mr.K Padmanabhan, Mr.Krishnan Akhileswaran, Mr.N Vaghul, Mr.Rafeeque Ahamed, Mr.Raj Kumar Menon, Mr.S K Venkataraman, Mr.S M Krishnan, Mr.S M Krishnan, Mr.Sanjay Nayar, Mr.Vinayak Chatterjee, Mrs.Preetha Reddy, Mrs.Sangita Reddy, Mrs.Shobana Kamineni.
Shareholding pattern as of 31st July, 2015
Investment Rationale
Robust growth with improvement in margins
The pharmacy business has been ramping up well in the past three years with revenues up at a CAGR of 28% driven by addition of new stores as well as growth in same store sales (SSS). Going forward, we expect Apollo to add about 250 new stores in 2-3 years. This coupled with 15-16% growth in the mature stores is expected to drive revenues. EBITDA margin is expected to improve to 4% in FY15.
Favorable environment for Pharma market
The Ministry of Communications and Information Technology has launched telemedicine services in collaboration with the Apollo Hospitals on August 25, under which people can consult doctors through video link and also order generic drugs online. Under the service, people can visit Common Service Centers (CSC) and fix an appointment for seeking expert consultancy with a doctor.
We also believe the doctors at Apollo Hospitals will be able to provide consultancy to the patients using the video link facilities
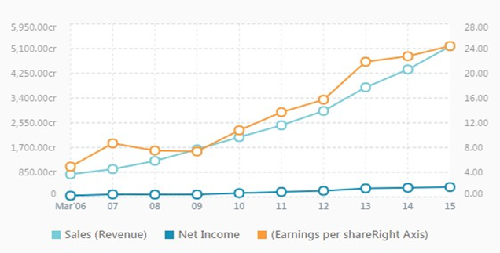
Revenues to grow at a three-year CAGR of 20% by FY18
Apollo’s businesses - hospitals and pharmacy – have recorded robust growth in revenues as well as profitability over the past three years. The hospital's business’ revenues grew 18% with more than 200 bps improvement in EBITDA margin. The pharmacy business’ revenues grew 28%, driven by the addition of new stores and ramp-up in existing stores, with more than 300 bps improvement in EBITDA margin in the past three years.
Healthcare services with a focus on specialties such as cardiology, neurosciences, orthopedics, and oncology. These specialties contribute 65% to the hospital's business revenues.
Prescription drugs, consumables, and surgical instruments; constitute 75% of total pharmacy sales. Also sells over the counter products and private goods has increased.
Geographic Presence
Apollo Hospitals is one of the largest organized healthcare service providers in India with a network of 6,000 owned beds (2,600 beds are under JVs) and more than 2,000 beds in the managed category and also one of the leading players in the organized pharmacy retail market with more than 1,400 stores. Optical Health Solutions (operating under the Medplus brand) is the second-largest organized pharmacy chain; currently has 1,050 stores.
Apollo Hospitals has a dominant presence in south India and around 40% in Chennai and Hyderabad alone. The Chennai cluster accounts for 45% of the hospital's business revenues and the Hyderabad cluster 20%.
Now it is looking to increase its presence in western India. In the Pharma business too, more than 60% of the stores are in the southern region.
Valuation
The pharmacy business sustained its growth momentum in Q1FY16 - incorporating the impact of the Hetero chain integration which was completed during the quarter &ndash, and revenues grew 35%. EBITDA margin improved above our expectations to 3.6% from 3.1% in Q1FY15. Excluding the Hetero contribution, the EBITDA margin was an impressive 3.9%. Going forward, the pharmacy business is expected to maintain its growth trajectory, aided by the addition of new stores and growth in same-store sales. We expect a two-year CAGR of 20% in FY18.
Conclusion and Recommendation
Based on the strong product portfolio and geographically diversified presence, ATS Research value the stock at 54x PE, which gives a target price of Rs 1525. We feel that investors could buy the stock at the CMP for the given target prices for a year from now.
Risks and Concerns
-
Indian pharmacy retail market is predominantly unorganized (95%). It is very difficult to project the future trend in case the unorganized sector flourish.
-
Inability to attract and retain medical professionals
-
Delays in the ramp-up of new hospitals
Financials
Apollo Hospitals Enterprise Ltd. key Products/Revenue Segments include
-
HealthCare Services which contributed Rs 2820.24 Cr to Sales Value (61.40% of Total Sales),
-
Pharmaceuticals which contributed Rs 1772.55 Cr to Sales Value (38.59% of Total Sales),
for the year ending 31-Mar-2015.
For the quarter ended 30-Jun-2015, the company has reported a Standalone sales of Rs. 1264.96 Cr., up 5.09% from last quarter Sales of Rs. 1203.69 Cr. and up 20.05% from last year same quarter Sales of Rs. 1053.72 Cr. Company has reported net profit after tax of Rs. 90.84 Cr. in latest quarter.
Q1FY16 Re'SUIts Summary {Standalone)
|
(Z mn) |
Q1 FY16 |
CI4 FY15 |
Q1F Y1 5 |
q-o - q (%) |
y-o -y (0/o) |
|
Net sales |
12,65D |
11,097 |
10,53T |
5.1 |
20.0 |
|
Raw materials cost |
6,725 |
6,299 |
5, i32 |
6.8 |
21.6 |
|
Raw materials cost (98 of net sales) |
1 |
5296 |
5396 |
83bps |
66bps |
|
Employee cost |
1,931 |
1,911 |
1,707 |
1.0 |
13.1 |
|
Other expenses |
2,183 |
2,081 |
1,735 |
4.9 |
25.8 |
|
EBITDA |
1,811 |
1,745 |
1,569 |
3.8 |
15.8 |
|
EBITDA margin |
14.3% |
14.59t |
14.B•/« |
|
|
|
Depreciation |
450 |
406 |
399 |
10.8 |
12.8 |
|
EBIT |
1,360 |
1,399 |
1,164 |
1.6 |
16.9 |
|
Interest and finance charges |
269 |
226 |
189 |
19.1 |
42.0 |
|
Operating PBT |
1,092 |
1,119 |
975 |
(1.9) |
12.0 |
|
Other income |
42 |
48 |
65 |
(12.9) |
(34.9) |
|
extraordinary income/(expense) |
|
5 |
|
|
|
|
PBT |
1,194 |
1,166 |
1,D39 |
(2.8) |
9.1 |
|
Tax |
225 |
393 |
212 |
(42.7) |
6 4 |
|
PAT |
908 |
779 |
827 |
17.5 |
9.8 |
|
Adj PAT |
908 |
768 |
827 |
18.9 |
9.8 |
|
Adj PAT margin |
7.2% |
6.4% |
7.9•/• |
|
|
|
No. of equity shares (mn) |
139.1 |
139 |
139 |
|
|
|
Adj EPS (T} |
6.5 |
5.5 |
5.9 |
18.9 |
9.8 |
Company Growth
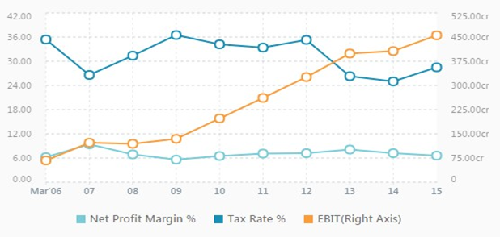
Company Profitability
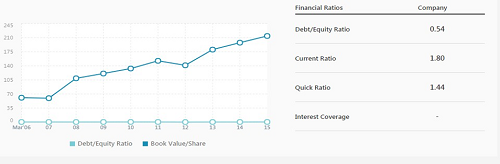
Company Financial Health
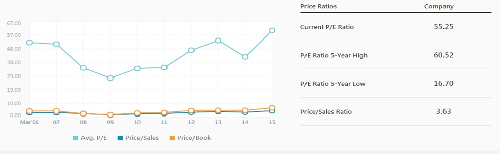
Price Ratios
- Share :


Post a Comment
|
DISCLAIMER |
This report is only for the information of our customers. Recommendations, opinions, or suggestions are given with the understanding that readers acting on this information assume all risks involved. The information provided herein is not to be construed as an offer to buy or sell securities of any kind. ATS and/or its group companies do not as assume any responsibility or liability resulting from the use of such information.