Amrutanjan Health Care Limited Research Report
|
Market Price |
Recommendation |
Target |
Time Horizon |
|
707.90 |
Buy |
890 |
1-Year |
Q2FY2023 REVIEW
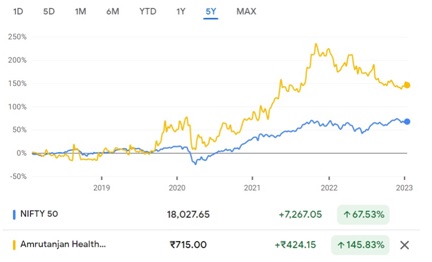
Amrutanjan Health Care Limited reported net revenue of ₹113.75 crores for the quarter ended September 30, 2022, compared to ₹114 crores for September 30, 2021. Profit After Tax was ₹12.76 crores for the quarter ended September 30, 2022, compared to ₹19.85 crores during the corresponding quarter of the previous year, respectively.
STOCKDATA
|
52 Week H/L |
688/954.60 |
|
Market Cap (crores) |
2,069 |
|
Face Value (₹) |
1.00 |
|
Book Value |
90.70 |
|
EPS TTM |
23.00 |
|
NSE Code |
AMRUTANJAN |
Amrutanjan Health Care Ltd - OVERVIEW
-
Amrutanjan was founded in Mumbai as a patent medicine business. Amrutanjan changed its name to Amrutanjan Limited in 1936 and became a public limited corporation. Amrutanjan Limited was replaced by Amrutanjan Healthcare Limited on November 13, 2007.
-
The company has 2,363 distributors, 613 suppliers, 647 employees, and 1.19 million outlets (Rubefacient).
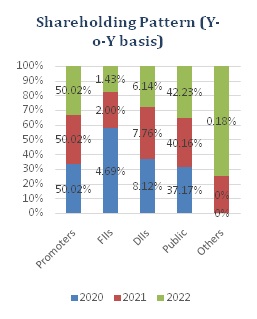
SHAREHOLDING PATTERN(%)
|
|
Mar-22 |
June-22 |
Sep-22 |
|
Promoter |
50.02 |
50.02 |
50.02 |
|
Public |
42.23 |
42.21 |
42.62 |
|
FII |
1.43 |
1.42 |
0.87 |
|
DII |
6.14 |
6.16 |
6.30 |
|
OTHERS |
0.18 |
0.18 |
0.18 |
BENCHMARK COMPARISON
Beta: 0.39 |
Alpha: 7.23 |
Risk Reward Ratio:1.45 |
Margin of Safety:20% |
BUSINESS
-
Shri K. Nageswara Rao Pantulu Garu established the company in 1893 as a patent medicine company in Bombay. Amrutanjan Pain Balm, the company's flagship product, was introduced.
-
Amrutanjan Health Care Limited, one of the top OTC companies in India, is renowned for offering products that promote speedy and natural recovery by fusing the natural principles of Ayurveda with contemporary technology.
-
The Company entered the field of pain management for the first time in 1893 with its iconic yellow balm, which quickly became the standard treatment for headaches and aches.
-
Since then, the company has grown into other industries, including those related to essentials like beverages, congestion management, women's health, and cleanliness. The resilient product line offered by the company consists of:
-
Amrutanjan pain balms and roll-ons.
-
Advanced body range products such as roll-ons, musclespray, and pain patches.
-
Cold & congestion products such as Relief cold rub, nasal inhalers, and cough syrup.
-
Beverages such as fruit-based rehydration drink - Fruitnik Electro+ and fruit juice - Fruitnik fruit drink.
-
Women’s hygiene product, Comfy Snug Fit sanitary Napkins.
-
Other essentials such as AmrutanjanDecorn corn caps, Amrutanjan No Germs hand sanitisers and Amrutanjan Stop Pain dental gel.
-
-
The fact that all of the items in its pain treatment category are all-natural and free of artificial substances like diclofenac demonstrates the company's commitment to encouraging healthful living.
-
Additionally, the company set up its own non-surgical pain management centre to address chronic pain and other conditions.
-
In 2011, the company introduced the "Comfy" brand after seeing how little menstrual health and cleanliness are known in India. Its current position as India's fourth-largest sanitary napkin brand by volume share demonstrates the company's dedication to the introduction of reasonably priced, high-quality goods.
-
Following are the reporting operations of the company:
-
OTC Products:
-
Manufacturing products for pain management, congestion management, and hygiene.
-
-
Beverages:
-
Manufacturing fruit juices and oral rehydration drinks.
-
-
Others:
-
Pain management center.
-
-
-
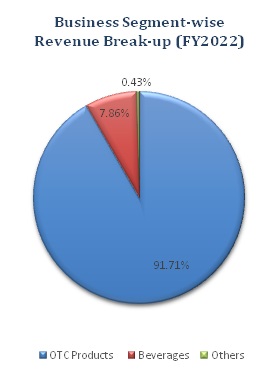
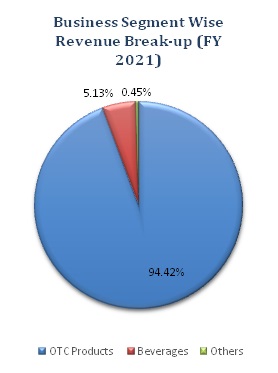
Revenue contribution from OTC products was 91.71%, Beverages was 7.86%, and from others was 0.43% in FY 2022 compared to 94.42%, and 0.45% in FY 2021, respectively.
-
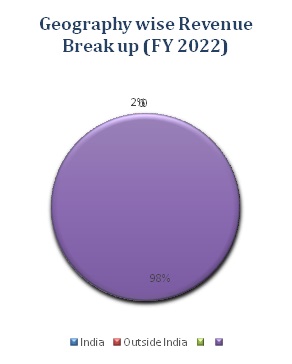
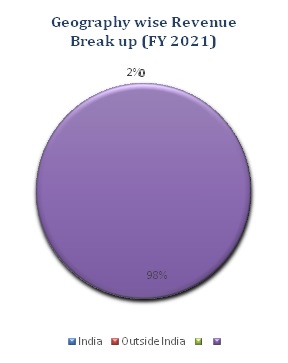
Geographically contribution from India was 98% and from countries were 2% in FY 2022 compared to 98% and 2% in FY 2021, respectively.
Amrutanjan Health Care Ltd - SWOT ANALYSIS
STRENGTH
-
Net debt-free company.
-
Strong financial performance.
-
The company hasa legacy of over 110 years.
-
Diversified product portfolio.
WEAKNESS
-
Decline quarterly net profit with a falling profit margin.
-
Trading below 52-week low.
-
Limited pricing flexibility because of intense competition.
OPPORTUNITIES
-
An established market position and strong brand recall in the pain management segment will help the company to maintain its stake in a related sector.
THREAT
-
Increasing global uncertainty.
-
An increase in prices of raw materials costs could impact the profit of the company.
AYURVEDA INDUSTRY ANALYSIS
-
Global civilizations have embraced the ancient science and treatment system known as ayurveda. After analysing a person's body type, heartbeat rhythms, appearance, vision, and other characteristics, Ayurveda diagnoses and treats illnesses.
-
The ayurveda system offers several protocols and therapies to treat illnesses through the use of plants, herbs, exercise, food, and lifestyle changes.
-
Oral care, skincare, make-up, hair care, and fragrances are the market segments for personal care products. The market for ayurvedic nutraceuticals, ayurvedic medicines, and dietary supplements is divided into the healthcare category. Companies throughout the nation are concentrating on creating cutting-edge ayurvedic products and raising consumer awareness.
-
An important element influencing the market for ayurvedic products in India is the growing consumer acceptance of natural and organic medications and the advantages they offer.
-
Ayurvedic products are now much more easily accessible in both urban and rural areas because of an improved distribution network. The Indian government is pushing the use of ayurvedic products through subsidies and awareness campaigns.
-
The market for ayurvedic products in India was worth ₹515.5 billion in 2021, and it is anticipated that the market would grow at a CAGR of 19.78% from 2022 to 2027 to reach ₹1,536.9 billion.
-
There are around 53000 MSMEs in the Ayush industry, according to data on the Udyam portal (Micro - 47,892; Small - 4,412; Medium - 719). Ayush is one of the top five health services with Medical Value Travel (MVT) in India according to export revenues for health services.
Amrutanjan Health Care Ltd - FINANCIAL OVERVIEW
Amrutanjan Health Care Ltd - QUARTERLY SUMMARY
|
Quarterly (INR in lakhs) |
Sep-22 |
Jun-22 |
Mar-22 |
Dec-21 |
Sep-21 |
|
Revenue from Operations |
11,071.93 |
7,095.42 |
10,655.30 |
11,069.59 |
11,038.20 |
|
Other income |
303.24 |
301.25 |
516.02 |
319.83 |
428.51 |
|
Total Income |
11,375.17 |
7,396.67 |
11,171.32 |
11,389.42 |
11,466.71 |
|
|
|||||
|
Total Expenditure |
9,631.16 |
6,869.18 |
9,166.31 |
8,594.94 |
8,824.19 |
|
EBIT |
1,744.01 |
527.49 |
2,005.01 |
2,794.48 |
2,642.52 |
|
|
|||||
|
Finance cost |
1.95 |
2.44 |
3.08 |
2.98 |
6.91 |
|
EBT before Exceptional Items |
1,742.06 |
525.05 |
2,001.93 |
2,791.50 |
2,635.61 |
|
|
|||||
|
Exceptional Items |
- |
- |
- |
- |
- |
|
PBT |
1,742.06 |
525.05 |
2,001.93 |
2,791.50 |
2,635.61 |
|
|
|||||
|
Tax Expenses |
465.56 |
158.65 |
531.34 |
733.72 |
650.83 |
|
PAT |
1,276.50 |
366.40 |
1,470.59 |
2,057.78 |
1,984.78 |
Amrutanjan Health Care Ltd - PROFIT AND LOSS STATEMENT(₹ IN Lakhs)
|
|
Mar-19 |
Mar-20 |
Mar-21 |
Mar-22 |
|
Revenue from Operations |
25,322.73 |
26,147.67 |
33,284.40 |
40,584.24 |
|
Other Income |
713.09 |
832.13 |
1,132.01 |
1,538.25 |
|
Total Income |
26,035.82 |
26,979.80 |
34,416.41 |
42,122.49 |
|
|
|
|
|
|
|
Cost of Goods sold |
11,886.85 |
11,707.12 |
`14,018.52 |
18,046.25 |
|
Gross Profit |
14,148.97 |
15,272.68 |
20,397.89 |
24,076.24 |
|
|
|
|
|
|
|
Excise Duty |
- |
- |
- |
- |
|
Employee Benefits Expense |
3,336.35 |
3,936.48 |
4,170.33 |
4,822.90 |
|
Other Expenses |
6,971.70 |
7,432.77 |
7,620.14 |
9,767.71 |
|
EBITDA |
3,840.92 |
3,903.43 |
8,607.42 |
9,485.63 |
|
|
|
|
|
|
|
Depreciation and Amortisation Expense |
315.97 |
435.94 |
366.97 |
379.52 |
|
EBIT |
3,524.95 |
3,467.49 |
8,240.45 |
9,106.11 |
|
|
|
|
|
|
|
Finance Costs |
8.22 |
22.10 |
50.00 |
48.45 |
|
EBT |
3,516.73 |
3,445.39 |
8,190.45 |
9,057.66 |
|
|
|
|
|
|
|
Tax Expense |
1,016.96 |
937.06 |
2,071.41 |
2,338.77 |
|
PAT |
2,499.77 |
2,508.33 |
6,119.04 |
6,718.89 |
|
|
|
|
|
|
|
EPS |
|
|
|
|
|
Basic |
8.55 |
8.58 |
20.94 |
23.00 |
|
Diluted |
8.55 |
8.58 |
20.93 |
22.98 |
|
|
|
|
|
|
|
Number of Shares |
|
|
|
|
|
Basic |
292.31 |
292.31 |
292.22 |
292.08 |
|
Diluted |
292.31 |
292.31 |
292.37 |
292.37 |
Amrutanjan Health Care Ltd - Balance Sheet (₹ in Lakhs)
|
|
Mar-19 |
Mar-20 |
Mar-21 |
Mar-22 |
|
ASSETS: |
|
|
|
|
|
Non-Current Assets: |
|
|
|
|
|
Property, Plant, and Equipment |
2,527.59 |
2,399.21 |
2,176.89 |
2,651.87 |
|
Right-of-Use Assets |
- |
158.26 |
113.42 |
68.68 |
|
Intangible Assets |
42.31 |
52.87 |
36.28 |
124.91 |
|
Capital Work-in-Progress |
- |
- |
41.39 |
1,626.49 |
|
Intangible Assets Under Development |
- |
- |
115.16 |
106.96 |
|
Finance Assets: |
||||
|
Investments |
1,581.24 |
1,820.64 |
1,201.21 |
535.97 |
|
Loans |
56.15 |
47.03 |
- |
- |
|
Other Financial Assets |
28.12 |
2,712.32 |
858.53 |
1,694.97 |
|
Tax Assets |
27.44 |
120.27 |
120.27 |
155.56 |
|
Deferred Tax Assets |
424.15 |
439.97 |
342.50 |
364.19 |
|
Other Non-Current Assets |
112.64 |
201.92 |
131.58 |
192.28 |
|
Total Non-Current Assets |
4,799.64 |
7,952.49 |
5,137.23 |
7,521.88 |
|
|
||||
|
Current Assets: |
||||
|
Inventories |
1,457.68 |
2,371.59 |
1,745.86 |
2,600.07 |
|
Financial Assets: |
||||
|
Investments |
170.52 |
- |
582.77 |
751.53 |
|
Trade Receivables |
3,293.35 |
2646.36 |
1,766.29 |
3,825.60 |
|
Cash and Cash Equivalents |
1,458.55 |
722.06 |
290.51 |
218.62 |
|
Other Bank Balances |
6,672.27 |
2,910.79 |
13,641.19 |
8,556.64 |
|
Other Financial Assets |
320.18 |
3,301.11 |
3,881.01 |
11,007.87 |
|
Other Current Assets |
589.15 |
630.12 |
382.21 |
504.60 |
|
Total Current Assets |
13,961.70 |
12,582.03 |
22,289.84 |
27,464.93 |
|
|
||||
|
Total Assets |
18,761.34 |
20,534.52 |
27,427.07 |
34,986.81 |
|
|
||||
|
EQUITY AND LIABILITIES: |
||||
|
Equity: |
||||
|
Equity Share Capital |
292.31 |
292.31 |
292.31 |
292.31 |
|
Other Equity |
14,281.32 |
15,650.25 |
21,264.16 |
26,220.07 |
|
Total Equity |
14,573.63 |
15,942.56 |
21,556.47 |
26,512.38 |
|
|
||||
|
Liabilities: |
||||
|
Non-Current Liabilities: |
||||
|
Financial Liabilities: |
||||
|
Lease Liabilities |
- |
111.69 |
70.28 |
31.06 |
|
Other Financial Liabilities |
27.60 |
20.60 |
17.60 |
16.60 |
|
Provisions |
548.54 |
553.40 |
572.38 |
679.47 |
|
Total Non-Current Liabilities |
576.14 |
685.69 |
660.26 |
727.13 |
|
|
||||
|
Current Liabilities: |
||||
|
Financial Liabilities: |
||||
|
Lease Liabilities |
- |
57.63 |
63.96 |
56.93 |
|
Trade Payables: |
||||
|
Total Outstanding Dues of Micro and Small Enterprises |
84.17 |
88.28 |
218.23 |
557.02 |
|
Other Creditors |
2,903.22 |
3045.97 |
3,848.64 |
5,487.86 |
|
Other Financial Liabilities |
183.53 |
252.29 |
244.66 |
571.06 |
|
Other Current Liabilities |
210.02 |
246.03 |
486.00 |
650.12 |
|
Provisions |
230.63 |
216.07 |
348.85 |
424.31 |
|
Total Current Liabilities |
3,611.57 |
3,906.27 |
5,210.34 |
7,747.30 |
|
|
||||
|
Total Equity & Liabilities |
18,761.34 |
20,534.52 |
27,427.07 |
34,986.81 |
Amrutanjan Health Care Ltd - Cash Flow Statement (₹ in Lakhs)
|
|
Mar-19 |
Mar-20 |
Mar-21 |
Mar-22 |
|
Net Profit Before Tax |
3,516.73 |
3,445.39 |
8,190.45 |
9,057.66 |
|
Net Cash from Operating Activities |
2,116.83 |
1,817.61 |
9,086.92 |
5,219.56 |
|
Net Cash Used for Investing Activities |
-1,101.16 |
-1,385.03 |
-8,776.08 |
-3,621.19 |
|
Net Cash From (Used For) Financing Activities |
-695.39 |
-1,168.98 |
-742.30 |
-1,670.24 |
|
Net Increase in Cash and Cash Equivalents |
320.28 |
-736.40 |
-431.46 |
-71.87 |
|
Cash And Cash Equivalents at The Beginning of The Year |
1,138.34 |
1,458.55 |
722.05 |
290.50 |
|
Cash And Cash Equivalents at The End of the Year |
1,458.55 |
722.05 |
290.50 |
218.61 |
Amrutanjan Health Care Ltd - Ratio Analysis
|
|
Mar-19 |
Mar-20 |
Mar-21 |
Mar-22 |
|
Profitability Ratio |
|
|
|
|
|
Gross Profit |
55.87% |
58.41% |
61.28% |
59.32% |
|
EBITDA Margin |
15.17% |
14.93% |
25.86% |
23.37% |
|
EBIT Margin |
13.92% |
13.26% |
24.76% |
22.44% |
|
Pre-Tax Margin |
13.89% |
13.18% |
24.61% |
22.32% |
|
Net Profit Margin |
9.87% |
9.59% |
18.38% |
16.56% |
|
|
||||
|
Return on Investment |
||||
|
Return on Asset – ROA |
14% |
13% |
26% |
22% |
|
Return on Capital Employed – ROCE |
25% |
22% |
42% |
37% |
|
Return on Equity – ROE |
18% |
16% |
33% |
28% |
|
|
||||
|
Liquidity Ratio (x) |
||||
|
Current ratio |
3.87 |
3.22 |
4.28 |
3.55 |
|
Quick Ratio |
3.46 |
2.61 |
3.94 |
3.21 |
|
|
||||
|
Turnover Ratio |
||||
|
Receivables Turnover |
8.3 |
8.8 |
15.1 |
60.8 |
|
Inventory Turnover |
9.5 |
6.1 |
6.8 |
8.3 |
|
Payables Turnover |
4.4 |
3.9 |
4.1 |
3.9 |
|
Asset Turnover |
1.4 |
1.3 |
1.4 |
1.3 |
|
|
||||
|
Solvency Ratio |
||||
|
Debt to Equity |
0.00 |
0.00 |
0.00 |
0.00 |
|
Interest Coverage Ratio |
429 |
157 |
165 |
188 |
Amrutanjan Health Care Ltd - Technical Analysis
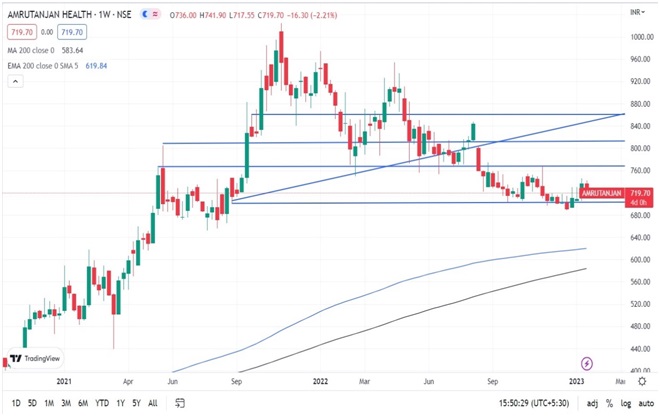
-
Stock is on a bullish trend on a weekly chart basis with a support level of ₹704 and a resistance level of ₹810
-
One can accumulate this stock at current levels.
Amrutanjan Health Care Ltd - Recommendation Rationale
-
Legacy of over 110 years and Experienced Management.
-
Since 1893, AHCL has produced ayurvedic pain relief balm, and it is currently run by promoters from the third generation.
-
It has a well-established market position and a strong brand recall in the pain management market as a result of its long history in the sector.
-
-
Increasing Distribution Network:
-
The Company's primary area of focus has always been on increasing distribution reach. As of Q4 FY22, about 12 lakh outlets nationwide offered AHCL's pain treatment products, which is the biggest number of outlets in AHCL's history.
-
The distribution of Comfy has also been steadily expanding, reaching 3.5 lakh stores in Q4 FY22.
-
With 5,000 distributors, super stockists, and sub-stockists to onboard, AHCL has invested in "Project M5K." To serve towns and villages with smaller populations, the company hired about 150 super stockists and 1,200 sub-stockists in FY22.
-
-
Strong Financial Profile:
-
With consistent cash accrual, a comfortable capital structure, and effective debt protection criteria, the financial risk profile should remain favorable.
-
On March 31, 2022, net worth was Rs 265.12 crore. Interest coverage of 188 times in FY2022 was a sign of strong debt protection metrics.
-
-
Diversified Products Portfolio:
-
The company has diversified products including the essentials like beverages, congestion management, women's health, and cleanliness. Some of the products included are Amderutanjan pain balms and roll-ons, Relief cold rubs, nasal inhalers, cough syrup, etc.
-
A diversified product portfolio helps the company to mitigate the overall risk.
-
Valuation
-
Amrutanjan Health Care Limited has shown revenue growth of 16% CAGR for FY2018-2022.
-
The company’s net profit has shown a growth of 35% CAGR for FY2018-2022.
-
The company’s ROE and ROCE are 28% & 37% for FY2022.
-
Subdued performance by the company in H1FY2023. The impact was due to:
-
decrease in consumer spending.
-
Channels have a comparatively high stock buildup.
-
Delays in the supply chain caused by the upgrade of the beverage plant (a line imported from Taiwan was delayed) led to problems with the supply of Electro + to the market.
-
A rise in the price of materials.
-
-
Revenue and profit will improve from H2FY2023.
-
We anticipate the company could generate lower revenue for the following FY 2023, comparable to the prior year, based on the company's present performance in FY 2022.
We used data from the last five years (2018-2022) to anticipate revenue for the fiscal years 2023–2027.
Amrutanjan Health Care Ltd - Estimated Income Statement (₹ in Lakhs)
|
|
Mar-23 |
Mar-24 |
Mar-25 |
Mar-26 |
Mar-27 |
|
|
2023-E |
2024-E |
2025-E |
2026-E |
2027-E |
|
Revenue |
41,058.79 |
48,114.99 |
56,392.95 |
66,105.15 |
77,501.09 |
|
COGS |
19,683.36 |
21,847.05 |
25,669.07 |
30,159.73 |
35,436.01 |
|
Gross Profit |
21,375.43 |
26,267.94 |
30,723.88 |
35,945.41 |
42,065.08 |
|
Employee Expenses |
4,805.31 |
5,645.97 |
6,633.70 |
7,794.23 |
9,157.79 |
|
Other Expenses |
9,243.65 |
10,860.78 |
12,760.81 |
14,993.25 |
17,616.23 |
|
EBITDA |
7,326.47 |
9,761.19 |
11,329.36 |
13,157.93 |
15,291.05 |
|
Depreciation |
406.72 |
466.29 |
537.76 |
623.03 |
724.34 |
|
EBIT |
6,919.75 |
9,294.90 |
10,791.60 |
12,534.90 |
14,566.71 |
|
Financial Cost |
36.82 |
49.45 |
57.42 |
66.69 |
77.50 |
|
EBT |
6,882.93 |
9,245.45 |
10,734.19 |
12,468.21 |
14,489.21 |
|
Tax expenses |
1,720.73 |
2,311.36 |
2,683.55 |
3,117.05 |
3,622.30 |
|
PAT |
5,162.20 |
6,934.09 |
8,050.64 |
9,351.16 |
10,866.91 |
Disclaimer: This report is only for the information of our customer Recommendations, opinions, or suggestions are given with the understanding that readers acting on this information assume all risks involved. The information provided herein is not to be construed as an offer to buy or sell securities of any kind.
- Share :


Post a Comment
|
DISCLAIMER |
This report is only for the information of our customers. Recommendations, opinions, or suggestions are given with the understanding that readers acting on this information assume all risks involved. The information provided herein is not to be construed as an offer to buy or sell securities of any kind. ATS and/or its group companies do not as assume any responsibility or liability resulting from the use of such information.