Adani Power Limited Research Report
|
Industry |
Market Price |
Recommendation |
Target |
Time Horizon |
|
Energy |
254.05 |
Buy |
340 |
1 Year |
Q4 FY 2022 Review
Adani Power Limited reported net revenue of ₹10,597.78 crores for the quarter ended March 31, 2022, compared to ₹6,373.60 crores for March 31, 2021. EBIT and Profit After Tax were ₹7,168.33 crores and ₹4,645.47 crores for the quarter ended March 31, 2022, as compared to ₹1361.20 crores and ₹13.13 crores during the corresponding quarter of the previous year respectively.
Adani Power Limited - Investment Summary
|
CMP (₹) |
254.05 |
|
52 Week H/L |
344.50/70.35 |
|
Market Cap (crores) |
1,10,983 |
|
Face Value (₹) |
10.00 |
|
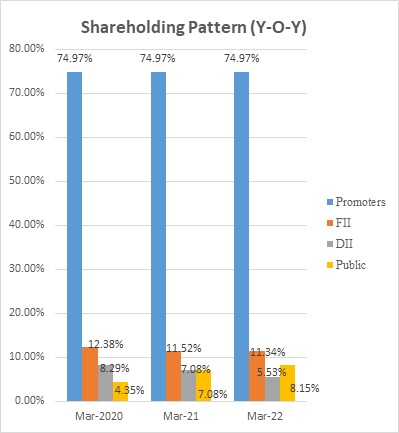
Promoter Holding (%) |
74.97 |
|
Non-Promoter Holding (%) |
25.03 |
|
Total (%) |
100.00 |
|
Book Value |
₹48.49 |
|
EPS TTM |
₹12.73 |
Adani Power Limited - Overview
-
Adani Power (APL), a subsidiary of the diversified Adani Group, is India's largest private thermal power generator.
-
The Company was the first in the world to establish a coal-based supercritical thermal power facility registered under the Kyoto Protocol's Clean Development Mechanism (CDM).
-
The company is also expanding a few existing power plants and constructing new ones, that will add more than 7000 MW of energy.
-
The company has been assigned BBB- (triple B minus) credit rating on a long-term bank facility.
Beta: 1.11 |
Alpha: 68.02 |
Risk Reward Ratio: 1.35 |
The margin of Safety: 18% |
Adani Power Limited - Quarterly Summary
|
Quarterly (INR in crores) |
Mar-22 |
Dec-21 |
Sep-21 |
Jun-21 |
Mar-21 |
|
Revenue from Operations |
10,597.78 |
5,360.88 |
5,183.66 |
6,568.86 |
6,373.60 |
|
Other income |
2,710.14 |
232.70 |
388.10 |
644.35 |
528.41 |
|
Total Income |
13,307.92 |
5,593.58 |
5,571.76 |
7,213.21 |
6,902.01 |
|
|
|||||
|
Total Expenditure |
6,139.59 |
4,374.47 |
4,805.31 |
5,695.19 |
5,540.81 |
|
EBIT |
7,168.33 |
1,219.11 |
766.45 |
1,518.02 |
1,361.20 |
|
|
|||||
|
Finance cost |
1,035.34 |
1,014.77 |
976.36 |
1,068.31 |
1,127.02 |
|
EBT before Exceptional Items |
6,132.99 |
204.34 |
-209.91 |
449.71 |
234.18 |
|
|
|||||
|
Exceptional items |
|||||
|
PBT |
6,132.99 |
204.34 |
-209.91 |
449.71 |
234.18 |
|
|
|||||
|
Tax Expenses |
1,487.52 |
-14.15 |
20.69 |
171.49 |
231.05 |
|
PAT |
4,645.47 |
218.49 |
-230.60 |
278.22 |
3.13 |
Business
-
Adani Power Limited (APL) is India's largest private-sector thermal power producer. The Company entered the market in 2006 when it began developing its first plant in Mundra, Gujarat.
-
The company has a total power generation capacity of 12,450 MW, which is made up of thermal power plants in Gujarat, Maharashtra, Karnataka, Rajasthan, and Chhattisgarh, as well as a 40 MW solar power project in Gujarat.
-
As part of its worldwide expansion and diversification objectives, the Company is developing a 1,600 MW Ultra Supercritical power plant in Godda, Jharkhand, to supply electricity to the Bangladesh Power Development Board via a dedicated transmission line under a long-term PPA.
-
In 2019, Adani Power Completes Acquisition of GMR Chhattisgarh Energy Ltd. at an enterprise value of approx. ₹3530 crores.
-
APL Power generation plants
PLANT
CAPACITY (MW)
Udupi, Karnataka
1200
Tiroda, Maharashtra
3300
Raipur, Chhattisgarh
1370
Raigarh, Chhattisgarh
600
Kawai, Rajasthan
1320
Mundra, Gujarat
4620
Bitta, Gujarat
40
Godda, Jharkhand(upcoming)
1600
-
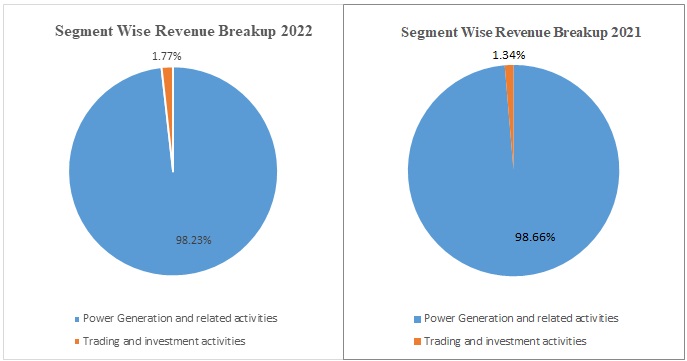
Out of the total revenue generated, 98.23% has been generated from power generation and related activities, whereas 1.77% has been generated from trading and investment activities in FY 2022, compared to 98.66% and 1.44% in FY 2021.
-
The company has upcoming power plants in Godda (Jharkhand), Chhindwara (MP), and Dahej (Gujarat) and also is expanding the capacity of its Udupi and Kawai Power plant to 1600 MW each.
-
The company has a mix of coastal, pit-head, and hinterland projects in high-demand areas near fuel supplies.
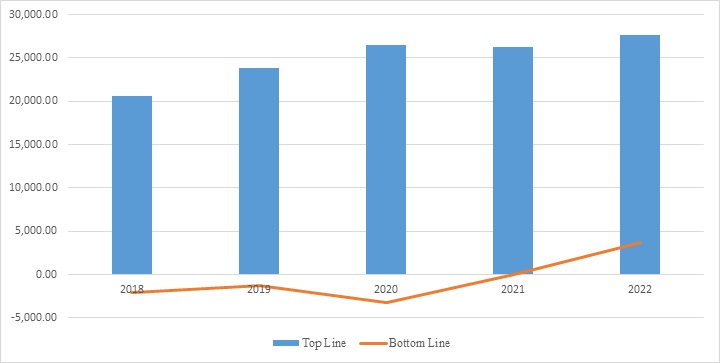
Adani Power Limited - Revenue Trend
Topline and Bottomline trend (crores)
Ratio Analysis
|
|
Mar-18 |
Mar-19 |
Mar-20 |
Mar-21 |
Mar-22 |
|
Profitability Ratio: |
|
|
|
|
|
|
Gross Profit |
39.12% |
33.22% |
33.58% |
43.63% |
46.73% |
|
EBITDA Margin |
29.95% |
31.11% |
26.67% |
40.41% |
49.76% |
|
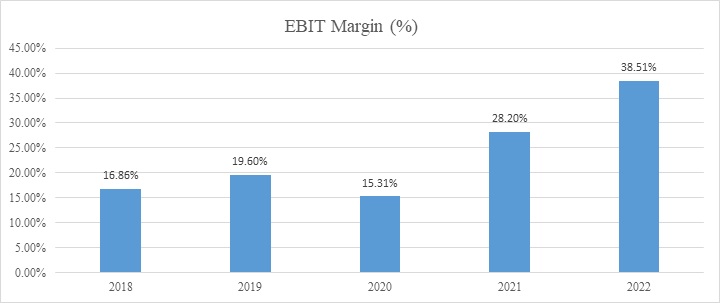
EBIT Margin |
16.86% |
19.60% |
15.31% |
28.20% |
38.51% |
|
Pre-Tax Margin |
-10.17% |
-4.09% |
-8.56% |
8.73% |
23.73% |
|
Net Profit Margin |
-10.14% |
-5.19% |
-11.94% |
0.10% |
13.40% |
|
|
|
|
|
|
|
|
Return on Investment: |
|
|
|
|
|
|
Return on Asset – ROA |
|
-1.80% |
-4.42% |
0.03% |
4.62% |
|
Return on Capital Employed – ROCE |
|
10.25% |
7.60% |
12.65% |
17.09% |
|
Return on Equity – ROE |
|
-28.83% |
-44.52% |
0.25% |
23.35% |
|
|
|
|
|
|
|
|
Liquidity Ratio: |
|
|
|
|
|
|
Current ratio (x) |
0.00 |
0.73 |
0.80 |
0.90 |
0.95 |
|
Quick Ratio |
0.00 |
0.66 |
0.66 |
0.79 |
0.81 |
|
|
|
|
|
|
|
|
Turnover Ratio: |
|
|
|
|
|
|
Receivables Turnover |
|
111.72 |
116.65 |
140.63 |
140.94 |
|
Inventory Turnover |
|
23.95 |
38.90 |
56.15 |
52.95 |
|
Payables Turnover |
|
160.06 |
124.13 |
116.05 |
90.39 |
|
Asset Turnover |
|
0.35 |
0.37 |
0.34 |
0.34 |
|
|
|
|
|
|
|
|
Solvency Ratio: |
|
|
|
|
|
|
Debt to Equity |
77.60 |
7.81 |
10.5 |
5.00 |
3.38 |
|
Interest Coverage Ratio |
0.62 |
0.82 |
0.76 |
1.44 |
2.60 |
Adani Power Limited - Financial Overview
Profit and Loss Statement (₹ in crores)
|
2018 |
2019 |
2020 |
2021 |
2022 |
|
|
Income |
|||||
|
Revenue from Operation |
20611.04 |
23884.18 |
26467.72 |
26221.48 |
27711.18 |
|
Other Income |
482.39 |
2477.45 |
1374.09 |
1928.2 |
3975.29 |
|
Total Income |
21093.43 |
26361.63 |
27841.81 |
28149.68 |
31686.47 |
|
Expenses |
|||||
|
Fuel Cost |
12548.36 |
15949.28 |
17580.39 |
14781.15 |
14762.21 |
|
Purchase of Stock in trade / Power for resale |
309.26 |
809.91 |
467.1 |
365.3 |
545.56 |
|
Transmission Charges |
437.29 |
621.82 |
664.31 |
642.77 |
|
|
Employee Benefits Expense |
353.74 |
363.28 |
426.82 |
431.54 |
470.31 |
|
Other Expenses |
1708.45 |
1370.59 |
1686.29 |
1310.66 |
1476.17 |
|
Total Expenses |
14919.81 |
18930.35 |
20782.42 |
17552.96 |
17897.02 |
|
EBITDA |
6173.62 |
7431.28 |
7059.39 |
10596.72 |
13789.45 |
|
Depreciation and Amortisation Expense |
2698.72 |
2750.62 |
3006.5 |
3201.65 |
3117.54 |
|
EBIT |
3474.9 |
4680.66 |
4052.89 |
7395.07 |
10671.91 |
|
Finance Cost |
5570.23 |
5656.52 |
5314.82 |
5106.33 |
4094.78 |
|
Less: Exceptional Items |
1002.99 |
||||
|
EBT |
-2095.33 |
-975.86 |
-2264.92 |
2288.74 |
6577.13 |
|
Net Tax paid |
-5.15 |
8.54 |
9.85 |
1018.76 |
1665.55 |
|
PAT |
-2090.18 |
-984.4 |
-2274.77 |
1269.98 |
4911.58 |
|
Distribution on Unsecured Perpetual Securities |
254.65 |
884.25 |
1245.04 |
1197.39 |
|
|
NET PAT |
-2090.18 |
-1239.05 |
-3159.02 |
24.94 |
3714.19 |
|
EPS |
|||||
|
Basic |
-5.42 |
-5.42 |
-5.42 |
-5.42 |
-5.42 |
|
Diluted |
-5.42 |
-5.42 |
-5.42 |
-5.42 |
-5.42 |
|
Number of shares |
|||||
|
Basic |
385.69 |
385.69 |
385.69 |
385.69 |
385.69 |
|
Diluted |
385.69 |
385.69 |
385.69 |
385.69 |
385.69 |
Adani Power Limited - Cash Flow Statement (₹ in crores)
|
|
Mar-18 |
Mar-19 |
Mar-20 |
Mar-21 |
Mar-22 |
|
Net Profit Before Tax |
-2,095.3 |
-975.86 |
-2,264.92 |
2,288.74 |
6,577.13 |
|
Net Cash from Operating Activities |
5,099.2 |
5,610.38 |
5,597.55 |
7,014.35 |
10,232.31 |
|
Net Cash Used for Investing Activities |
-519.00 |
-984.24 |
-2,328.11 |
-2,187.57 |
572.11 |
|
Net Cash From (Used For) Financing Activities |
4,600.1 |
-4,663.44 |
-2,377.18 |
-5,654.84 |
-10,337.86 |
|
Net Increase in Cash and Cash Equivalents |
-19.39 |
-37.30 |
892.26 |
-828.06 |
466.56 |
|
Cash And Cash Equivalents at The Beginning of The Year |
81.01 |
61.62 |
24.54 |
941.10 |
113.04 |
|
Cash And Cash Equivalents at The End of the Year |
61.62 |
24.54 |
941.10 |
113.04 |
781.95 |
Balance Sheet (₹ in crores)
|
2018 |
2019 |
2020 |
2021 |
2022 |
||
|
ASSETS: |
||||||
|
Non-current Assets |
||||||
|
(a) Property, Plant and Equipment |
51940.42 |
50224.25 |
55571.1 |
52575.24 |
53071.62 |
|
|
(b) Capital Work-In-Progress |
119.86 |
350.08 |
2346.77 |
6439.42 |
10269.74 |
|
|
(c) Goodwill |
190.61 |
190.61 |
190.61 |
190.61 |
190.61 |
|
|
(d) Intangible Assets |
6.11 |
3.9 |
84.1 |
85.45 |
11.98 |
|
|
(e) Financial Assets |
||||||
|
(i) Investments |
0.01 |
0.01 |
0.01 |
0.01 |
0.01 |
|
|
(ii) Loans |
1389.95 |
1584.18 |
||||
|
(iii) Other Financial Assets |
352.6 |
1376.62 |
427.91 |
245.44 |
856.04 |
|
|
(f) Other Non-current Assets |
1571.95 |
1052.42 |
1811.32 |
1627.39 |
1352.95 |
|
|
Total Non-Current Assets |
55571.51 |
54782.07 |
60431.82 |
61163.56 |
65752.95 |
|
|
Current Assets |
||||||
|
(a) Inventories |
869.19 |
1224.08 |
2522.77 |
2025.11 |
2258.27 |
|
|
(b) Financial Assets |
||||||
|
(i) Investments |
2.71 |
2.79 |
20.09 |
183.24 |
||
|
(ii) Trade Receivables |
6069.8 |
8550.99 |
8366.47 |
11839.28 |
9560.92 |
|
|
(iii) Cash and Cash Equivalents |
61.62 |
24.54 |
941.1 |
113.04 |
782.37 |
|
|
(iv) Other Bank balances |
794.99 |
891.34 |
1038.21 |
1494.28 |
1582.31 |
|
|
(v) Loans |
3.66 |
5.7 |
3.05 |
8.83 |
7.62 |
|
|
(vi) Other Financial Assets |
5191.73 |
1573.29 |
767.65 |
325.12 |
308.28 |
|
|
(c) Other Current Assets |
960.73 |
925.68 |
951.14 |
1023.08 |
1545.06 |
|
|
Total Current Assets |
13951.72 |
13198.33 |
14593.18 |
16848.83 |
16228.07 |
|
|
Assets classified as held for sale. |
4.2 |
793.52 |
||||
|
Total Assets |
69523.23 |
67984.6 |
75025 |
78805.91 |
81981.02 |
|
|
CAPITAL & LIABILITIES: |
||||||
|
Equity Share Capital |
3856.94 |
3856.94 |
3856.94 |
3856.94 |
3856.94 |
|
|
Unsecured Perpetual Securities |
8000 |
8615 |
12615 |
13215 |
||
|
Other Equity |
-2972.4 |
-4144.65 |
-5991.5 |
-3359.35 |
1631.5 |
|
|
Non - Controlling Interests |
0.01 |
0.01 |
||||
|
Total Capital and Reserves |
884.54 |
7712.29 |
6480.45 |
13112.6 |
18703.44 |
|
|
Non-current Liabilities |
||||||
|
(a) Financial Liabilities |
||||||
|
(i) Borrowings |
34559.85 |
36410.27 |
44566.34 |
39957 |
37871.32 |
|
|
(ia) Lease Liabilities |
99.57 |
94.36 |
||||
|
(ii) Other Financial Liabilities |
82.12 |
62.86 |
339.21 |
703.08 |
960.37 |
|
|
(b) Provisions |
46.07 |
61.48 |
88.43 |
86.95 |
220.87 |
|
|
(c) Deferred Tax Liabilities (Net) |
212.83 |
178.49 |
266.07 |
1328.08 |
2499.78 |
|
|
(d) Other Non-current Liabilities |
5700.06 |
5399.41 |
5095.35 |
4791.28 |
4487.21 |
|
|
Total Non-Current Liabilities |
40600.93 |
42112.51 |
50355.4 |
46965.96 |
46133.91 |
|
|
Current Liabilities |
||||||
|
(a) Financial Liabilities |
||||||
|
(i) Borrowings |
14560.34 |
7073.53 |
7801.81 |
12454.27 |
10924.36 |
|
|
(ia) Lease Liabilities |
7.84 |
8.39 |
||||
|
(ii) Trade Payables |
7626.37 |
6361.74 |
5596.05 |
3803.13 |
3508.21 |
|
|
(iii) Other Financial Liabilities |
5277.61 |
4036.65 |
4118.7 |
1138.88 |
1167.32 |
|
|
(b) Other Current Liability |
563.67 |
608.53 |
603.18 |
1217.35 |
861.36 |
|
|
(c) Provisions |
9.82 |
11.2 |
39.44 |
60.17 |
28.71 |
|
|
(d) Current Tax Liabilities (Net) |
68.15 |
29.97 |
45.71 |
645.32 |
||
|
Total Current Liabilities |
28037.81 |
18159.8 |
18189.15 |
18727.35 |
17143.67 |
|
|
Total Liabilities |
68638.74 |
60272.31 |
68544.55 |
65693.31 |
63277.58 |
|
|
Total Capital & Liabilities |
69523.28 |
67984.6 |
75025 |
78805.91 |
81981.02 |
|
Industry Overview
-
With an installed power capacity of 395.07GW as of January 2022, India is the world's third-largest producer and second-largest consumer of electricity.
-
More industrial activity will drive up energy demand, while a growing population, increased electrification, and per-capita usage will give an additional push.
-
In January 2022, India's installed renewable energy capacity was 152.36 GW, accounting for 38.56% of the total installed power capacity.
-
India is on track to achieve the Saubhagya scheme's goal of 100 % hold electrification. The Saubhagya project had electrified about 2.82 crore households as of March 2021.
-
The government earmarked Rs.19,500 crore (the US $2.57 billion) in the Union Budget 2022-23 for a PLI scheme to stimulate the manufacturing of high-efficiency solar modules.
-
The Government has allowed 100% FDI in the power sector, which has boosted FDI inflow in this sector.
-
Between FY19 and FY23, India's electricity sector is expected to attract investment worth Rs. 9-9.5 trillion (US $128.24-135.37 billion).
-
India wants to lower the emissions intensity of its gross domestic product (GDP) by 33% by 2030 to 35% and to boost the use of non-fossil fuels to 40% of total energy generation capacity.
-
From April 2000 to December 2021, India received US$ 11.21 billion in FDI in the non-conventional energy industry. Since 2000, the new renewable energy sectors have added the most power-producing capacity.
-
Even though the government emphasizes generating electricity from renewable sources, coal is predicted to be a primary fuel for power generation until 2030.
-
India's per capita power consumption has been increasing at a rate of roughly 5% per year, reaching 1208 kWh/person by FY 2019-20, which is low compared to the global average of around 3316 kWh/person. This opens the door for more development in this sector.
Adani Power Limited - Technical Analysis
-
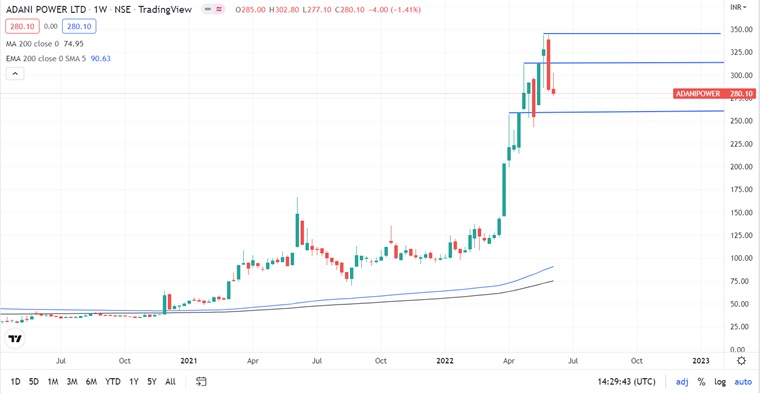
Stock is trading above EMA 200 and MA 200 indicators, with a strong support level of ₹260 and a resistance level at ₹344
-
One can accumulate this share at the current price.
Recommendation Rationale:
-
For the FY22, Adani Power Limited’s revenue increased to ₹27,711.18 crores, compared to the previous year at ₹26,221.48. It also registered a net Profit After Tax of ₹3,714.19 crores compared to the last year at ₹24.94 crores.
-
The Adani plants are strategically placed. They are either located near coal mines or port cities, which helps them reduce their fuel costs.
-
The company has generated positive EPS in the last couple of years.
-
The company has Long-term Fuel Supply Agreements (FSAs) that tie up 84 % of coal requirements, providing long-term insight into fuel security.
-
The company is also expanding; it has acquired stressed power assets in Chhattisgarh, Madhya Pradesh, at attractive valuations, which will help it expand its capacity.
-
The rising demand for electricity in the economy supported by huge generational capacity is a positive factor for the company.
-
The near pit-head power plants of Raipur and Raigarh are benefitting from near coal supplies and improved merchant margins that allow them to conduct hassle-free operations all year.
Valuation
-
The company’s revenue has increased at a CAGR of 7.68% from FY 2019-to 2022.
-
The strategic location of the company's plants has provided them with a competitive advantage; they are either near coal mines or near port cities, which helps them reduce fuel costs. This will assist them in sustaining revenue while lowering costs.
-
For 2022, the company’s ROE and ROCE were 23.05% and 17.09%, respectively.
-
Q1FY2023 results could get impacted due to the increasing inflation, which will increase the fuel cost for the company.
-
Based on the performance of the company in FY22, we expect the company could post higher revenue for the current financial (2023), corresponding to the previous year.
-
We have taken data for the last five years (2018-2022) and forecasted revenue for FY 2023-2027. Revenue growth is assumed to be 5.19%.
Adani Power Limited - Estimated Income Statement (₹ in crores):
|
|
Mar-23 |
Mar-24 |
Mar-25 |
Mar-26 |
Mar-27 |
|
|
2023-E |
2024-E |
2025-E |
2026-E |
2027-E |
|
Revenue |
33,854.70 |
36,186.81 |
38,695.37 |
41,393.90 |
44,296.96 |
|
COGS |
17,512.30 |
18,857.41 |
20,305.83 |
21,865.51 |
23,544.98 |
|
Gross Profit |
16,342.39 |
17,329.40 |
18,389.53 |
19,528.39 |
20,751.98 |
|
Employee Expenses |
498.76 |
537.07 |
578.32 |
622.74 |
670.57 |
|
Other Expenses |
2,766.18 |
2,978.64 |
3,207.43 |
3,453.79 |
3,719.07 |
|
EBITDA |
13,077.46 |
13,813.69 |
14,603.78 |
15,451.85 |
16,362.33 |
|
Depreciation |
3,118.53 |
3,094.05 |
3,078.98 |
3,073.20 |
3,076.60 |
|
EBIT |
9,958.92 |
10,719.63 |
11,524.80 |
12,378.66 |
13,285.73 |
|
Financial Cost |
3,821.21 |
4,113.09 |
4,422.03 |
4,749.65 |
5,097.69 |
|
EBT |
6,137.71 |
6,606.54 |
7,102.77 |
7,629.00 |
8,188.03 |
|
Tax expenses |
1,554.28 |
1,673.00 |
1,798.66 |
1,931.92 |
2,073.48 |
|
PAT |
4,583.44 |
4,933.54 |
5,304.11 |
5,697.08 |
6,114.55 |
|
Distribution on Unsecured Perpetual Securities |
1,197.39 |
1,197.39 |
1,197.39 |
1,197.39 |
1,197.39 |
|
Net PAT |
3,386.05 |
3,736.15 |
4,106.72 |
4,499.69 |
4,917.16 |
-
We initiate coverage on Adani Power Limited with a “BUY” and a 1-year Target Price of 340.
Disclaimer: This report is only for the information of our customer Recommendations, opinions, or suggestions are given with the understanding that readers acting on this information assume all risks involved. The information provided herein is not to be construed as an offer to buy or sell securities of any kind.
- Share :


Post a Comment
|
DISCLAIMER |
This report is only for the information of our customers. Recommendations, opinions, or suggestions are given with the understanding that readers acting on this information assume all risks involved. The information provided herein is not to be construed as an offer to buy or sell securities of any kind. ATS and/or its group companies do not as assume any responsibility or liability resulting from the use of such information.