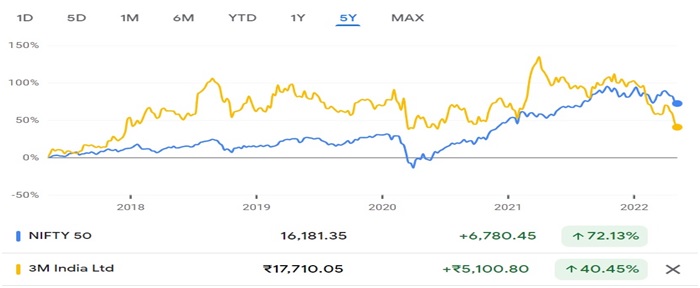
3M India Limited Research Report
|
Industry |
Market Price |
Recommendation |
Target |
Time Horizon |
|
Diversified |
18,641.45 |
Buy |
22,471 |
1 Year |
Q3 FY 2022 Review
3M India Limited reported net revenue of ₹82,628.09 lakhs for the quarter ended December 31, 2021, compared to ₹74,144.06 lakhsfor December 31, 2020. EBIT andProfit After Tax were ₹8,947.83 lakhs and ₹6,674.44 lakhsfor the quarter ended, 31, 2021, as compared to ₹8,159.93 lakhs and ₹5,938.71 lakhs, during the corresponding quarter of the previous year respectively.
3M India Limited - Investment Summary
|
CMP (₹) |
18,641.45 |
|
52 Week H/L |
17,594/27800 |
|
Market Cap (crores) |
20,999 |
|
Face Value (₹) |
10.00 |
|
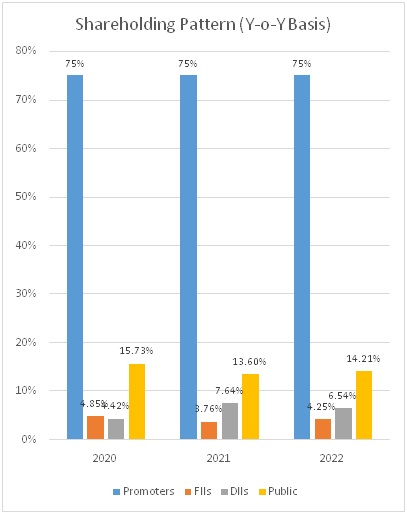
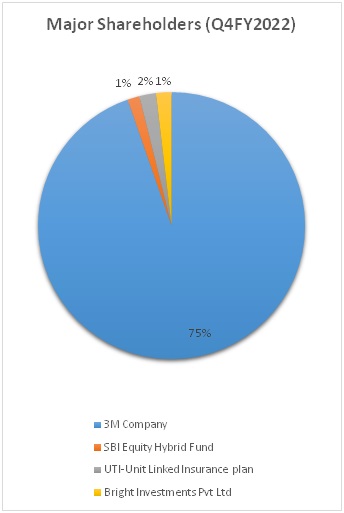
Promoter Holding (%) |
75 |
|
Non-Promoter Holding (%) |
25 |
|
Total (%) |
100.00 |
|
Book Value |
₹1,696 |
|
EPS TTM |
₹144.14 |
Overview
-
3M India Limited is the flagship listed company of 3M company, of USA in India
-
3M company, USA holds a 75%stake in the company and is in the diversified business of technology and sciencewith a global presence.
-
The company has manufacturing facilitiesin Ahmedabad, Bengaluru, and Pune.
-
The company board of directors had approved the amalgamation of wholly-owned subsidiary 3M Electro & Communication Private Limited (Transferor company), into its holding company 3M India (Transferee company). The company has filed an application before NCLT for the approval of the merger and is waiting for the hearing date.
Beta: 0.51 |
Alpha:-14.30 |
Risk Reward Ratio: 1.33 |
Margin of Safety:17% |
3M India Limited - Quarterly Summary
|
Quarterly (INR in lakhs) |
Dec-21 |
Sep-21 |
Jun-21 |
Mar-21 |
Dec-20 |
|
Revenue from Operations |
82,628.09 |
84,009.60 |
74,387.20 |
82,720.66 |
74,144.06 |
|
|
|||||
|
Other income |
768.92 |
842.96 |
799.12 |
716.85 |
568.85 |
|
Total Income |
83,397.01 |
84,852.56 |
75,186.32 |
83,437.51 |
74,712.91 |
|
|
|||||
|
Total Expenditure |
74,449.18 |
76,122.29 |
71,076.86 |
73,918.94 |
66,552.98 |
|
EBIT |
8,947.83 |
8,730.27 |
4,109.46 |
9,518.57 |
8,159.93 |
|
|
|||||
|
Finance cost |
49.43 |
69.14 |
58.37 |
30.22 |
86.25 |
|
EBT before excpetional Items |
8,898.40 |
8,661.13 |
4,051.09 |
9,488.35 |
8,073.68 |
|
|
|||||
|
Exceptional items |
0.00 |
0.00 |
0.00 |
0.00 |
0.00 |
|
PBT |
8,898.40 |
8,661.13 |
4,051.09 |
9,488.35 |
8,073.68 |
|
|
|||||
|
Tax Expenses |
2,223.96 |
2,239.56 |
1,041.50 |
2,441.39 |
2,134.97 |
|
PAT |
6,674.44 |
6,421.57 |
3,009.59 |
7,046.96 |
5,938.71 |
Business
-
3M India Limited was incorporated in the year 1987 with the name Birla 3M Pvt Limited.
-
The company was converted into a public limited company in April 1989.
-
In 2007, the Birla group exited from 3M by selling its stake to foreign institutional investors and others.
-
3M India is a diversified company engaged in manufacturing, and trading, a wide variety of products catering to Industrial, transportation, automotive, construction, engineering, healthcare, traffic and safety, household, and office segments.
-
Its operations are broadly classified into 4 Business segments:
-
Safety and Industrial Business:
-
This segment includes businesses that serve the global industrial, electrical, and safety markets.
-
This business segment consists of personal safety, Industrial adhesives and tapes, abrasives, closure and masking systems, electrical markets, automotive aftermarkets, and roofing granules.
-
-
Healthcare Business:
-
Products and services provided to these and other markets include medical and surgical supplies, oral care solutions (dental and orthodontic products), separation and purification sciences, inhalation and transdermal drug delivery, and food safety products.
-
-
Transportation and Electronics Business:
-
This segment includes businesses that serve global transportation and electronic original equipment manufacturer,and customers.
-
This business segment consists of electronics (display materials and systems, electronic materials solutions), automotive and aerospace, commercial solutions, advanced materials, and transportation safety.
-
-
Consumer Business:
-
This business serves global consumers and consists of home improvement, stationery and office supplies, home care, and consumer care.
-
This segment also includes, within the construction and home improvement Division, certain retail auto care product lines.
-
Products in this segment include office supply products, stationery products, home improvement products, home care products, protective material products, certain consumer retail personal safety products, and consumer healthcare products.
-
-
-
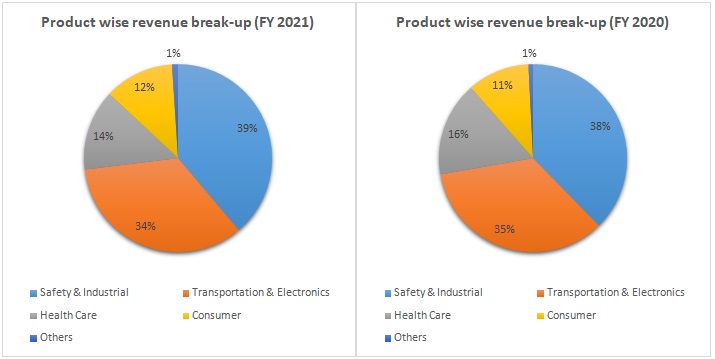
Out of the total revenue,34% hasbeen generated from Transportation & Electronics, 39% from Safety & Industrial, 14% from Health care, 12% from Consumer, and 1% from othersin FY 2021 compared to35%, 38%, 16%, 11%and 1% in FY 2020, respectively.
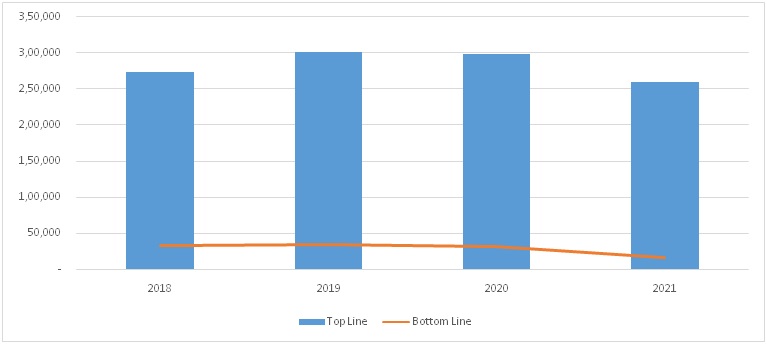
3M India Limited - Revenue Trend
Topline and Bottomline trend (Lakhs)
Ratio Analysis
|
|
Mar-19 |
Mar-20 |
Mar-21 |
|
Profitability Ratio |
|
|
|
|
Gross Profit |
48.18% |
43.40% |
39.56% |
|
EBITDA Margin |
18.97% |
16.59% |
10.91% |
|
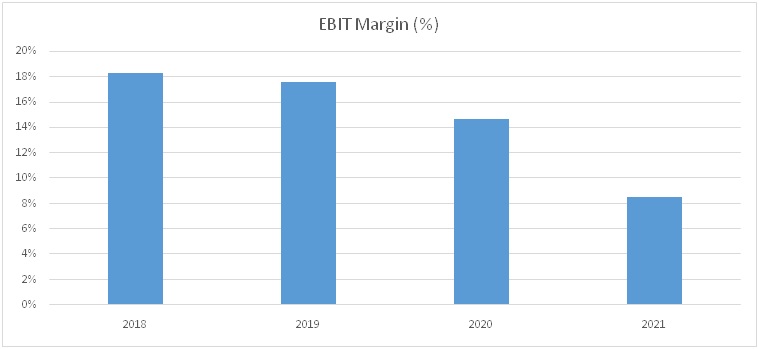
EBIT Margin |
17.52% |
14.61% |
8.54% |
|
Pre-Tax Margin |
17.49% |
14.48% |
8.44% |
|
Net Profit Margin |
11.37% |
10.79% |
6.23% |
|
|
|||
|
Return on Investment |
|||
|
Return on Asset – ROA |
15.50% |
14.35% |
6.47% |
|
Return on Capital Employed – ROCE |
41.22% |
26.69% |
11.82% |
|
Return on Equity – ROE |
27.46% |
20.24% |
8.87% |
|
|
|||
|
Liquidity Ratio |
|||
|
Current ratio (x) |
2.6 |
3.3 |
3.1 |
|
Quick Ratio |
1.9 |
2.5 |
2.4 |
|
|
|||
|
Turnover Ratio |
|||
|
Receivables Turnover |
5.2 |
5.3 |
5.1 |
|
Inventory Turnover |
4.1 |
4.1 |
3.6 |
|
Payables Turnover |
4.7 |
5.5 |
4.7 |
|
Asset Turnover |
1.36 |
1.33 |
1.04 |
|
|
|||
|
Solvency Ratio |
|||
|
Debt to Equity |
0.01 |
0.00 |
0.00 |
|
Interest Coverage Ratio |
470.9 |
119.1 |
90.6 |
3M India Limited - Financial Overview
3M India Limited - Profit and Loss Statement (₹ in lakhs)
|
|
Mar-18 |
Mar-19 |
Mar-20 |
Mar-21 |
|
Revenue from Operations |
2,73,418.82 |
3,01,682.24 |
2,98,655.09 |
2,60,483.14 |
|
Other Income |
4,478.82 |
3,683.12 |
4,589.56 |
2,473.73 |
|
Total Revenue |
2,77,897.64 |
3,05,365.36 |
3,03,244.65 |
2,62,956.87 |
|
|
|
|
|
|
|
Cost of Goods Sold |
1,40,288.05 |
1,60,017.53 |
1,73,628.58 |
1,59,907.67 |
|
Gross Profit |
1,37,609.59 |
1,45,347.83 |
1,29,616.07 |
1,03,049.20 |
|
|
|
|
|
|
|
Excise Duty |
2,436.13 |
- |
- |
- |
|
Employee Benefit Expenses |
35,604.95 |
33,020.88 |
32,858.51 |
36,990.48 |
|
Other Expenses |
45,228.55 |
55,085.17 |
47,201.52 |
37,636.56 |
|
EBITDA |
54,339.96 |
57,241.78 |
49,556.04 |
28,422.16 |
|
|
|
|
|
|
|
Depreciation and Amoritsation |
4,350.60 |
4,375.63 |
5,933.25 |
6,184.59 |
|
EBIT |
49,989.36 |
52,866.15 |
43,622.79 |
22,237.57 |
|
|
|
|
|
|
|
Finance Costs |
202.92 |
112.26 |
366.21 |
245.41 |
|
EBT |
49,786.44 |
52,753.89 |
43,256.58 |
21,992.16 |
|
|
|
|
|
|
|
Tax Expenses |
17,456.34 |
18,439.39 |
11,039.66 |
5,754.51 |
|
PAT |
32,330.10 |
34,314.50 |
32,216.92 |
16,237.65 |
|
|
|
|
|
|
|
EPS |
|
|
|
|
|
Basic |
286.99 |
304.61 |
285.99 |
144.14 |
|
Diluted |
286.99 |
304.61 |
285.99 |
144.14 |
|
|
|
|
|
|
|
Number of Shares |
|
|
|
|
|
Basic |
112.65 |
112.65 |
112.65 |
112.65 |
|
Diluted |
112.65 |
112.65 |
112.65 |
112.65 |
3M India Limited - Cash Flow Statement (₹ in lakhs)
|
|
Mar-18 |
Mar-19 |
Mar-20 |
Mar-21 |
|
Net Profit Before Tax |
51,445.82 |
56,016.62 |
43,256.58 |
21,992.16 |
|
Net Cash from Operating Activities |
3,619.54 |
25,298.17 |
24,504.67 |
32,107.48 |
|
Net Cash Used for Investing Activities |
2,510.23 |
-55,341.25 |
270.41 |
-1,418.65 |
|
Net Cash From (Used For) Financing Activities |
-206 |
325 |
-2,465 |
-2,504 |
|
Net Increase in Cash and Cash Equivalents |
5,924 |
-29,718 |
22,311 |
28,185 |
|
Cash And Cash Equivalents at The Beginning of the Year |
79,542 |
85,465 |
55,748 |
78,058 |
|
Cash And Cash Equivalents at The End of the Year |
85,465 |
55,748 |
78,058 |
1,06,243 |
Balance Sheet (₹ in lakhs)
|
|
Mar-18 |
Mar-19 |
Mar-20 |
Mar-21 |
|
ASSETS: |
|
|
|
|
|
Non-Current Assets: |
|
|
|
|
|
Property, Plant and Equipment |
30,301.70 |
28,580.31 |
26,174.38 |
24,154.70 |
|
Capital Work-in-Progress |
591.37 |
1,238.16 |
690.85 |
2,351.89 |
|
Right-of-Use Assets |
- |
- |
4,389.14 |
2,435.01 |
|
Intangible Assets |
41.09 |
25.90 |
34.77 |
34.12 |
|
Financial Assets: |
|
|
|
|
|
Trade Receivables |
77.26 |
- |
- |
- |
|
Loans Receivable |
1,237.69 |
975.24 |
1,289.00 |
869.85 |
|
Deferred Tax Assets |
1,887.07 |
3,071.79 |
2,236.32 |
3,079.50 |
|
Income Tax Assets |
5,234.80 |
6,460.97 |
10,135.26 |
11,984.40 |
|
Other Non-Current Assets |
4,059.58 |
5,797.45 |
5,311.87 |
6,471.33 |
|
Total Non-Current Assets |
43,430.56 |
46,149.82 |
50,261.59 |
51,380.80 |
|
|
|
|
|
|
|
Current Assets: |
|
|
|
|
|
Inventories |
36,747.54 |
41,126.40 |
43,865.69 |
45,654.77 |
|
Financial Assets: |
|
|
|
|
|
Trade Receivables |
56,808.77 |
58,655.97 |
53,424.91 |
48,852.84 |
|
Cash and Cash Equivalents |
85,465.25 |
55,746.66 |
78,057.16 |
1,06,242.29 |
|
Loans Receivables |
217.06 |
472.67 |
149.82 |
678.09 |
|
Other Financial Assets |
4,323.18 |
3,247.46 |
2,766.22 |
2,939.83 |
|
Other Current Assets |
3,487.26 |
6,433.28 |
8,610.21 |
9,404.41 |
|
Total Current Assets |
1,87,049.06 |
1,65,682.44 |
1,86,874.01 |
2,13,772.23 |
|
|
|
|
|
|
|
Asset Held for Sale |
579.89 |
- |
- |
- |
|
|
|
|
|
|
|
Total Assets |
2,31,059.51 |
2,11,832.26 |
2,37,135.60 |
2,65,153.03 |
|
|
|
|
|
|
|
EQUITY & LIABILITIES: |
|
|
|
|
|
Equity: |
|
|
|
|
|
Equity Share Capital |
1,126.51 |
1,126.51 |
1,126.51 |
1,126.51 |
|
Other Equity |
1,05,545.44 |
1,42,157.06 |
1,73,960.76 |
1,89,906.40 |
|
Total Equity |
1,06,671.95 |
1,43,283.57 |
1,75,087.27 |
1,91,032.91 |
|
|
|
|
|
|
|
Liabilities: |
|
|
|
|
|
Financial Liabilities: |
|
|
|
|
|
Lease Liabilities |
- |
- |
1,763.63 |
1,043.02 |
|
Borrowings |
523.92 |
760.54 |
- |
- |
|
Provisions |
2,369.11 |
2,890.09 |
3,155.24 |
4,214.91 |
|
Total Non-Current Liabilities |
2,893.03 |
3,650.63 |
4,918.87 |
5,257.93 |
|
|
|
|
|
|
|
Current Liabilities: |
|
|
|
|
|
Financial Liabilities: |
|
|
|
|
|
Lease Liabilities |
- |
- |
2,449.21 |
1,269.57 |
|
Trade Payables: |
|
|
|
|
|
Total outstanding due Micro and Small Enterprise |
1,293.36 |
2,098.21 |
1,484.75 |
2,154.83 |
|
Other Creditors |
34,364.26 |
33,483.33 |
29,802.28 |
38,940.02 |
|
Other Financial Liabilities |
74,293.37 |
16,030.26 |
11,348.26 |
16,114.41 |
|
Other Current Liabilities |
2,763.87 |
4,268.30 |
3,471.87 |
3,036.73 |
|
Provisions |
6,863.50 |
7,182.29 |
6,293.59 |
5,067.13 |
|
Income Tax Liabilities |
1,916.17 |
1,835.67 |
2,279.50 |
2,279.50 |
|
Total Current Liabilities |
1,21,494.53 |
64,898.06 |
57,129.46 |
68,862.19 |
|
|
|
|
|
|
|
Total Equity & Liabilities |
2,31,059.51 |
2,11,832.26 |
2,37,135.60 |
2,65,153.03 |
Industry Overview
-
Electronics Systems:
-
India is one of the largest consumer electronics markets in the Asia Pacific region.
-
India is expected to have a digital economy of $ 1 trillion by 2025.
-
India’s exports are set to increase rapidly from $ 10 billion in FY 2021 to $ 120 billion in FY 2026.
-
Production of mobile handsets is further stated to increase in value from $ 30 million in FY 2021 to $ 126 million in FY 2026.
-
India produces roughly 10 mobile phones per second which amounts to $ 930 worth of production per every second.
-
Sub-Section Semiconductor and Display Manufacturing:
-
The Semicon India Program with an incentive outlay of $10 billion was launched with the vision to develop a sustainable semiconductor and display ecosystem in the country.
-
Semiconductors are the fundamental building blocks of electronic devices used to power a vast array of electronic devices ranging from smartphones and cloud servers to modern cars, Industrial automation, critical infrastructure, and defense system.
-
The global manufacturing market was $440 billion in 2020 and is expected to reach $ 1 trillion by 2030.
-
India’s Display Panel market is estimated to be $7 billion and is expected to grow to $15 billion by 2025.
-
-
3M has applied decades of science-based expertise to a range of materials of semiconductor manufacturing processes and equipment solutions.
-
The company’s innovationsare used in etching and deposition, CMP and surface finishing material for wafer processing, advanced packaging materials, and tape and reel for chip transport.
-
-
Healthcare Industry:
-
Healthcare has become one of India’s largest sectors, both in terms of revenue and employment.
-
Healthcare comprises hospitals, medical devices, clinical trials, outsourcing, telemedicine, medical tourism, health insurance, and medical equipment.
-
₹80,200.65 crores were allocated to the Ministry of Health and Family Welfare.
-
The Indian government is planning to introduce a credit incentive program worth ₹500 crores to boost the country’s healthcare infrastructure.
-
3Mprovides stethoscopes and surgical masks to dental supplies and medical equipment in the health care segment.
-
-
Infrastructure Sector:
-
The infrastructure sector is a key driver of the Indian economy.
-
The infrastructure sector includes power, bridges, dams, roads, and urban infrastructure development.
-
In the Budget for FY 2022-23,the major focus was on the infrastructure sector.
-
This will give a boost to the products of 3M India’s transportation segment.
-
Technical Analysis
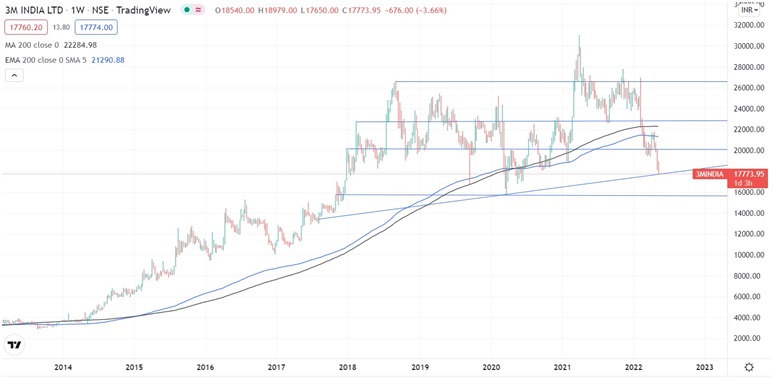
-
Stock is trading belowEMA 200 and MA 200indicators, with a strong support level of ₹16,000and a resistance level of ₹22901.
-
Share is consolidating at the current level and can break out once it crosses the level of ₹18,145.
Recommendation Rationale:
-
3M India limited revenue and PAT for the first nine months (FY 2022) increased by 35.58% and 75.23% to ₹241,024.89 lakhs and ₹16,105.69 lakhs, as compared to the previous year.
-
The company is virtually debt-free.
-
Diversification in the business segment will help the company to mitigate the risk in the ongoing market situation.
-
The company could get eligible for the PLI scheme in the electronics or semiconductor sector, because of the availability of technology and productswhich are required in both sectors.
-
The strong branding, established distribution network, healthy relations with global clients, and strong support of the parent company in terms of technology will help the company have healthy revenue growth in nearer future.
Valuation
-
The company’s revenue and PAT for FY 2020 and FY 2021 were impacted due to a slowdown in the economy, the Covid-19 pandemic, and disruption of the supply chain.
-
the easing of covid-19, recovery in the economy, and increasing demand for the company’s products have helped the company to give a strong performance in the current quarters of FY2022.
-
Based on the current performance of the company in the first nine months, we expect the company could post higher revenue for the current financial (2022), corresponding to the previous year.
-
We have taken data for the last four years (2018-2021) and forecasted revenue for FY 2022-2026. Revenue growth is assumed to be 20%.
Estimated Income Statement (₹ inLakhs):
-
We initiate coverage on3M India Limited with a “BUY” and a 1-year Target Price of ₹ 22,471.
Disclaimer: This report is only for the information of our customers Recommendations, opinions, or suggestions are given with the understanding that readers acting on this information assume all risks involved. The information provided herein is not to be construed as an offer to buy or sell securities of any kind.
- Share :


Post a Comment
|
DISCLAIMER |
This report is only for the information of our customers. Recommendations, opinions, or suggestions are given with the understanding that readers acting on this information assume all risks involved. The information provided herein is not to be construed as an offer to buy or sell securities of any kind. ATS and/or its group companies do not as assume any responsibility or liability resulting from the use of such information.