Honda India Power Products Limited Research Report
|
Industry |
Market Price |
Recommendation |
Target |
Time Horizon |
|
Electrical Equipment |
1,155 |
BUY |
1,415 |
6 Months |
Honda India Power Products Limited (HIPP) Q3 FY 2022 Review
Honda India Power Products Limited (HIPP) reported net revenue of ₹33,751 lakhs for the quarter ended December 31, 2021, as compared to ₹28,546 lakhs for the quarter, ended December 31, 2020. EBIT and Profit After Tax were ₹3,118 lakhs and ₹2,322 lakhs for the quarter ended, December 31, 2021, as compared to ₹2,875 lakhs and ₹2,076 lakhs, during the corresponding quarter of the previous year.
Honda India Power Products Limited Investment Summary
|
CMP (₹) |
1,175 |
|
52 Week H/L |
1,517/915 |
|
Market Cap (Lakhs) |
1,24,369 |
|
Face Value (₹) |
10.00 |
|
Promoter Holding (%) |
66.67 |
|
Non-Promoter Holding (%) |
33.33 |
|
Total (%) |
100.00 |
|
Book Value |
₹ 600 |
|
EPS TTM |
₹ 48 |
Honda India Power Products Limited Overview
-
Honda India Power Products (HIPP), a leading manufacturer of power products in India, successfully crossed the 5 million units accumulated production milestone in February 2022.
-
In July 2020, the company changed its name from ‘Honda Siel Power Products Limited’ to ‘Honda India Power Products Limited.
-
It exports its products to 35 plus countries across the world.
-
The company has a network of 650 plus dealers through which it caters to
Honda India Power Products Limited Quarterly Summary
|
Quarterly (INR in lakhs) |
Dec-21 |
Sep-21 |
Jun-21 |
Mar-21 |
Dec-20 |
|
Sales |
33,751 |
23,087 |
26,424 |
29,562 |
28,546 |
|
Other Income |
259 |
591 |
874 |
439 |
407 |
|
Total Revenue |
34,010 |
23,678 |
27,298 |
30,001 |
28,953 |
|
Total Expenditure |
30,892 |
21,548 |
24,645 |
27,975 |
26,078 |
|
EBIT |
3,118 |
2,130 |
2,653 |
2,026 |
2,875 |
|
Interest |
7 |
7 |
6 |
8 |
10 |
|
EBT |
3,111 |
2,123 |
2,647 |
2,018 |
2,865 |
|
Tax |
787 |
533 |
666 |
489 |
773 |
|
Net Profit |
2,324 |
1,590 |
1,981 |
1,529 |
2,092 |
Business
-
Honda India Power Products Limited (HIPP) is one of the first Japanese companies to enter the Indian market in 1985 and thereby contribute to strengthening economic relations between India and Japan.
-
HIPP is engaged in manufacturing and marketing of Portable Gensets, Water Pumps, General Purpose Engines, Lawn Mower, Brush Cutters, and Tillers.
-
The company is part of ‘Honda Group’.
-
There was an agreement between Honda Motor Company Limited (parent) and Usha International Limited to operate the company as a joint venture entity. The following agreement was terminated on 31st March 2020. Post the termination, Usha International Limited has required, re-classification from promoter to the ‘public’ category.
-
In FY 2020, Generator accounted for 62% of total revenue, followed by Engines (15%), Water Pumps (10%), Tillers (1%), and Others (12%). (Data for FY 2021 was not available)
-
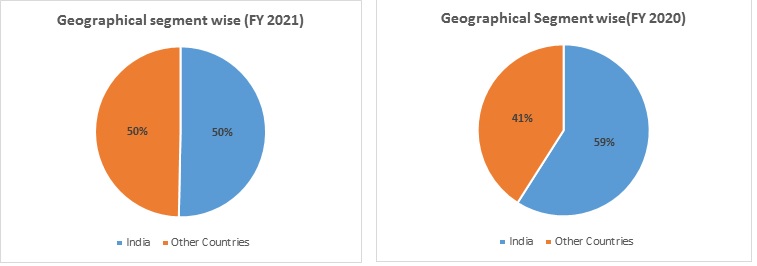
Out of the total revenue, 50% of revenue have generated from India and 50% from other countries in FY 2021, compared to 59% and 41% in FY 2020.
-
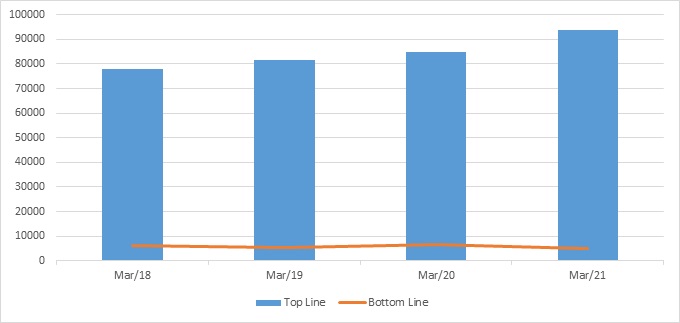
Revenue has increased by 11% in FY 2021, compared to the previous year. But net profit dropped by 27% in FY 2021, compared to the previous year. Drop in profit was due to an increase in the prices of raw materials.
HIPP Revenue Trend
Topline and Bottomline trend (Lakhs)
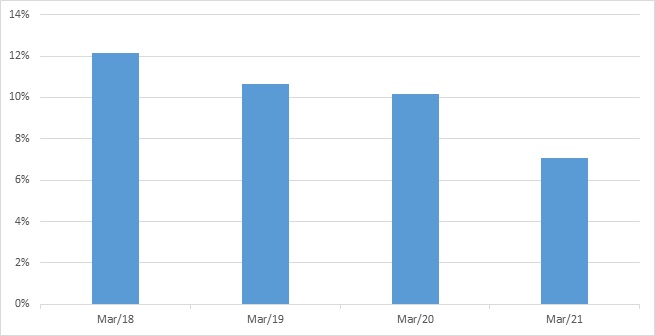
EBITDA Margin Trend (%)
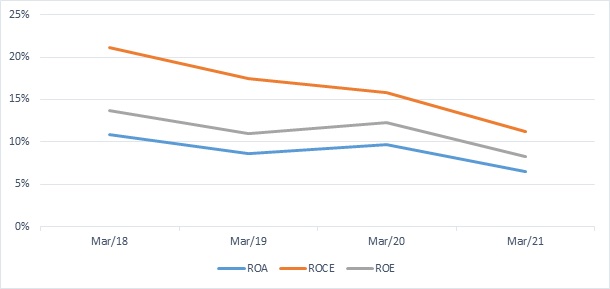
ROE, ROCE, and Asset Turnover trend (%)
Ratio Analysis
|
RATIO |
Mar-18 |
Mar-19 |
Mar-20 |
Mar-21 |
|
Profitability Ratio |
|
|
|
|
|
Gross Margin |
43% |
41% |
43% |
37% |
|
EBITDA Margin/ Operating Profit Margin |
15% |
13% |
13% |
9% |
|
EBIT Margin |
12% |
11% |
10% |
7% |
|
Pre-Tax Margin |
12% |
11% |
10% |
7% |
|
Net Profit Margin |
7.90% |
6.64% |
7.84% |
5.18% |
|
|
|
|
|
|
|
Return on Investment |
|
|
|
|
|
Return on Asset – ROA |
10.87% |
8.65% |
9.71% |
6.46% |
|
Return on Capital Employed – ROCE |
21.07% |
17.51% |
15.86% |
11.27% |
|
Return on Equity – ROE |
13.69% |
10.92% |
12.24% |
8.28% |
|
|
|
|
|
|
|
Liquidity Ratio |
|
|
|
|
|
Current Ratio (X) |
3.47 |
3.57 |
3.86 |
3.27 |
|
Quick Ratio (X) |
2.72 |
2.76 |
2.40 |
2.39 |
|
Cash Ratio (x) |
1.58 |
0.44 |
0.25 |
0.74 |
|
|
|
|
|
|
|
Turnover Ratio |
|
|
|
|
|
Receivables Turnover |
17.28 |
12.82 |
14.99 |
14.24 |
|
Inventory Turnover |
4.31 |
4.95 |
3.11 |
3.27 |
|
Payables Turnover |
6.27 |
6.44 |
6.21 |
6.58 |
|
Asset Turnover |
1.38 |
1.30 |
1.24 |
1.25 |
|
|
|
|
|
|
|
Solvency Ratio |
|
|
|
|
|
Debt to Equity Ratio (X) |
- |
- |
- |
- |
|
Interest Coverage ratio |
394.08 |
724.41 |
287.86 |
237.21 |
Honda India Power Products Limited Financial Overview
Profit and Loss Statement (₹ Lakhs)
|
Mar-18 |
Mar-19 |
Mar-20 |
Mar-21 |
|
|
Revenue |
77,741 |
81,588 |
84,864 |
93,894 |
|
Other Income |
1,494 |
1,766 |
1,576 |
1,453 |
|
Total Revenue |
79,235 |
83,354 |
86,440 |
95,347 |
|
|
|
|
|
|
|
Cost Of Goods Sold |
45,582 |
50,081 |
50,231 |
60,801 |
|
Gross Profit |
33,653 |
33,273 |
36,209 |
34,546 |
|
|
|
|
|
|
|
Excise Duty |
961 |
- |
- |
- |
|
Employee Benefits Expenses |
8,649 |
9,846 |
11,436 |
10,740 |
|
Others Expenses |
12,334 |
12,621 |
13,929 |
15,138 |
|
EBITDA |
11,709 |
10,806 |
10,844 |
8,668 |
|
|
|
|
|
|
|
Depreciation And Amortisation |
2,251 |
2,113 |
2,208 |
2,026 |
|
EBIT |
9,458 |
8,693 |
8,636 |
6,642 |
|
|
|
|
|
|
|
Finance Cost |
24 |
12 |
30 |
28 |
|
EBT Before Exceptional Items |
9,434 |
8,681 |
8,606 |
6,614 |
|
|
|
|
|
|
|
Exceptional Items |
- |
-350 |
437 |
- |
|
EBT |
9,434 |
8,331 |
9,043 |
6,614 |
|
|
|
|
|
|
|
Tax Expenses |
3,293 |
2,916 |
2,391 |
1,747 |
|
PAT |
6,141 |
5,415 |
6,652 |
4,867 |
|
|
|
|
|
|
|
EPS |
|
|
|
|
|
Basic |
61 |
53 |
66 |
48 |
|
Diluted |
61 |
53 |
66 |
48 |
|
|
|
|
|
|
|
Number Of Shares |
|
|
|
|
|
Basic |
101 |
101 |
101 |
101 |
|
Diluted |
101 |
101 |
101 |
101 |
Cash Flow Statement (Lakhs)
|
Mar-18 |
Mar-19 |
Mar-20 |
Mar-21 |
|
|
Net Profit Before Tax and Extra Ordinary Items |
9,434 |
8,681 |
8,606 |
6,614 |
|
Net Cash from Operating Activities |
5,500 |
2,059 |
-1,762 |
15,151 |
|
Net Cash Used for Investing Activities |
-6,538 |
-1,263 |
4,724 |
-9,249 |
|
Net Cash From (Used For) Financing Activities |
-940 |
-1,113 |
-1,311 |
-1,359 |
|
Net Increase in Cash and Cash Equivalents |
-1,978 |
-317 |
1,651 |
4,543 |
|
Cash And Cash Equivalents at The Beginning of The Year |
4,104 |
2,116 |
1,796 |
3,463 |
|
Cash And Cash Equivalents at The End of Year |
2,116 |
1,796 |
3,463 |
8,026 |
Balance Sheet (Lakhs)
|
Mar-18 |
Mar-19 |
Mar-20 |
Mar-21 |
|
|
ASSETS: |
|
|
|
|
|
Non-Current Assets: |
|
|
|
|
|
Property, Plant and Equipment |
9,709 |
9,258 |
9,192 |
8,548 |
|
Right-Of-Use Assets |
- |
- |
496 |
514 |
|
Capital Work-in-Progress |
94 |
344 |
189 |
247 |
|
Intangible Assets |
364 |
197 |
73 |
67 |
|
Financial Assets: |
|
|
|
|
|
Loans and Advances |
95 |
84 |
100 |
103 |
|
Other Financial Assets |
3,055 |
1,108 |
6 |
3,669 |
|
Deferred Tax Assets |
185 |
363 |
531 |
613 |
|
Non-Current Assets |
3,336 |
3,920 |
4,401 |
4,416 |
|
Other Non-Current Assets |
676 |
1,008 |
907 |
1,026 |
|
Total Non-Current Assets |
17,514 |
16,282 |
15,895 |
19,203 |
|
|
|
|
|
|
|
Current Assets: |
|
|
|
|
|
Inventories |
9,076 |
11,168 |
21,105 |
16,049 |
|
Financial Assets: |
|
|
|
|
|
Trade Receivables |
6,360 |
6,369 |
4,953 |
8,230 |
|
Cash and Cash Equivalents |
2,116 |
1,796 |
3,463 |
8,026 |
|
Other Bank Balances |
17,067 |
4,300 |
85 |
5,570 |
|
Loans and Advances |
66 |
16,068 |
16,068 |
16,046 |
|
Other Financial Assets |
675 |
371 |
155 |
148 |
|
Other Current Assets |
6,780 |
9,194 |
9,806 |
5,825 |
|
Total Current Assets |
42,140 |
49,266 |
55,635 |
59,894 |
|
|
|
|
|
|
|
Total Assets |
59,654 |
65,548 |
71,530 |
79,097 |
|
|
|
|
|
|
|
EQUITY AND LIABILITIES: |
|
|
|
|
|
Equity: |
|
|
|
|
|
Equity Share Capital |
1,014 |
1,014 |
1,014 |
1,014 |
|
Other Equity |
- |
- |
- |
- |
|
Reserve and Surplus |
46,431 |
50,696 |
55,947 |
59,537 |
|
Total Equity |
47,445 |
51,710 |
56,961 |
60,551 |
|
|
|
|
|
|
|
Liabilities: |
|
|
|
|
|
Non-Current Liabilities: |
|
|
|
|
|
Financial Liabilities |
|
|
|
|
|
Lease Liabilities |
- |
- |
117 |
137 |
|
Provisions |
67 |
52 |
39 |
68 |
|
Total Non-Current Liabilities |
67 |
52 |
156 |
205 |
|
|
|
|
|
|
|
Current Liabilities: |
|
|
|
|
|
Financial Liabilities |
|
|
|
|
|
Trade Payables: |
|
|
|
|
|
Total Outstanding Dues of Micro and Small Enterprise |
103 |
261 |
623 |
1,074 |
|
Other Creditors |
7,504 |
8,053 |
8,116 |
10,377 |
|
Lease Liabilities |
- |
- |
2 |
7 |
|
Other Financial Liabilities |
1,305 |
1,708 |
1,609 |
1,458 |
|
Contract Liabilities |
- |
1,101 |
917 |
2,252 |
|
Provisions |
1,054 |
1,088 |
1,544 |
1,687 |
|
Other Current Liabilities |
2,176 |
1,575 |
1,602 |
1,486 |
|
Total Current Liabilities |
12,142 |
13,786 |
14,413 |
18,341 |
|
|
|
|
|
|
|
Total Equity and Liabilities |
59,654 |
65,548 |
71,530 |
79,097 |
Industry Overview
Generator Set (Genset):
-
The Indian diesel Genset market is estimated to grow at a CAGR of 9.4% during 2021-2030.
-
The key factors responsible for the growth of the market include the advancement of the manufacturing industry and the rising demand for power for construction projects.
-
The pandemic had a negative impact on the supply of Diesel Genset in India, owing to the shutting down of manufacturing plants to curtail the spread of the disease. Demand for Gensets in 2020 also reduced due to the lockdown of various commercial establishments, including retail stores, offices, hotels, and airports. The reduction in the demand resulted in a price drop for diesel gensets, which further hampered the market progress.
-
The 5 kilovolt-Ampere (kVA)-75 kVA category to holds the largest share in the Indian Diesel Genset market, both in terms of volume and value in 2021. This is attributed to the high-volume demand for the gensets from residential facilities, commercial complexes, small industries, restaurants, and telecom towers. Furthermore, macro-economic growth in the country and a surge in the number of construction and infrastructure projects are expected to result in high demand for these gensets for meeting primary and auxiliary power requirements.
General Purpose Engine and Water Pumps:
-
General Purpose Engines are used as the power sources for various machines used in construction, industry, agriculture, home use lawn mowing and gardening equipment, as well as various handheld devices including hedge trimmers.
-
Water pumps are vital for supplying and draining water at firms, construction sites, as well as during droughts, floods, or other such disasters or emergencies, and can be divided into several types according to their application.
-
There are general purpose pumps that are used for the irrigation of fields and at various work sites, high-pressure pumps that can be easily transported and used anywhere.
-
Infrastructure growth, normal rainfall, farm mechanization, increasing rural income, government support, scarcity of farm labour could provide a boost to the demand for General Purpose Engines and Water Pumps.
Honda India Power Products Limited Technical Analysis
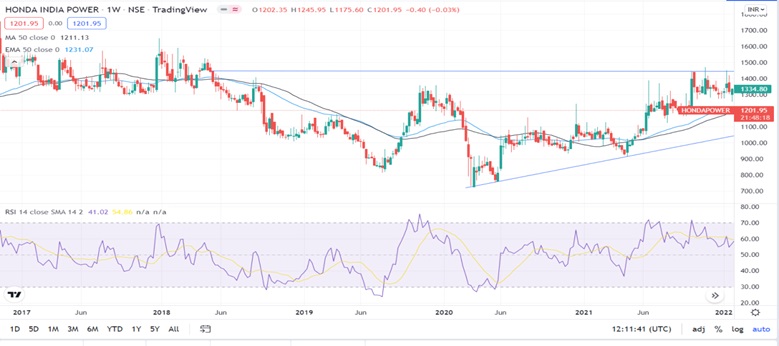
-
Stock is trading below EMA 50 and MA 50 indicator, with a support level of ₹915 and a resistance level of ₹1453. It is a good opportunity to double down your holdings in this company.
-
Currently with an RSI 14 of 41.02. Company is facings selling pressure.
Recommendation Rationale:
-
For the first nine months, Honda India Power Products Limited revenue increased by 29% to ₹83,262 lakhs, compared to the previous year at ₹64,332 lakhs. Profit After Tax increased by 58% to ₹1,986 lakhs, compared to the previous year at ₹1,258 lakhs.
-
The company has successfully crossed the 5 million units accumulated production milestone in February 2022.
-
The Company is virtually Debt-free.
-
The company has a network of 650 plus dealers through which it caters to 25 lakhs plus customers.
-
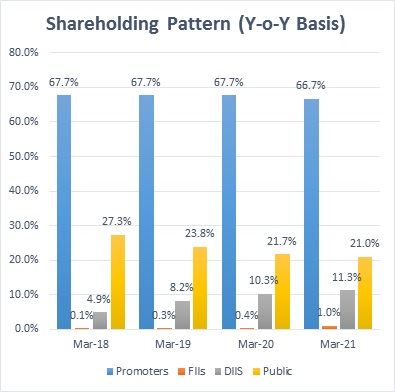
Shares of the promoter are not pledged.
-
FPI/FII and the mutual fund have increased their shareholding pattern.
-
A normal monsoon, increasing rural income, Government subsidy for farmers, increasing demand for the infrastructure sector, could increase demand for the company’s products.
Valuation
-
The company has grown at a 6% Compounded annual growth rate, from FY 2018 to FY 2021.
-
The net profit of the company has reduced from 7.90% in FY 2018 to 5.18% in FY 2021, except there was a slight increase in profit in FY 2020 at 7.84%, compared to 6.64% in FY 2019.
-
Profit margins in FY 2021, were impacted due to an increase in the prices of raw materials.
-
Based on the current performance of the company in the first nine months, we expect, the company could post higher revenue for the current financial (2022), corresponding to the previous year. But the results would not be comparable based on a Year-on-Year basis, due to the covid-19 lockdown, that took place in FY 2020.
-
Still, there could be a pressure of an increase in prices of basic raw materials, due to inflation, which could impact the profit margin of the company in the first quarter of FY 2023. It would be worth seeing how the company manages its expenses.
-
We have taken data for the last 5 years (2017-2021), forecasted revenue for FY 2022-2026. Revenue growth is assumed to be 7%.
Honda India Power Products Limited Estimated Income Statement (₹ in Lakhs):
|
Mar-22 |
Mar-23 |
Mar-24 |
Mar-25 |
Mar-26 |
|
|
|
2022-E |
2023-E |
2024-E |
2025-E |
2026-E |
|
Revenue |
1,01,248 |
1,07,518 |
1,14,181 |
1,21,260 |
1,28,782 |
|
COGS |
61,836 |
65,713 |
69,833 |
74,211 |
78,863 |
|
Gross Profit |
39,412 |
41,805 |
44,348 |
47,049 |
49,919 |
|
Employee Expenses |
12,430 |
13,209 |
14,037 |
14,917 |
15,852 |
|
Other Expenses |
16,232 |
17,250 |
18,331 |
19,480 |
20,702 |
|
EBITDA |
10,750 |
11,346 |
11,980 |
12,652 |
13,365 |
|
Depreciation |
1,846 |
1,680 |
1,562 |
1,481 |
1,431 |
|
EBIT |
8,904 |
9,666 |
10,418 |
11,171 |
11,934 |
|
Financial Cost |
38 |
41 |
44 |
47 |
50 |
|
EBT |
8,866 |
9,625 |
10,374 |
11,124 |
11,884 |
|
Tax expenses |
2,342 |
2,542 |
2,740 |
2,938 |
3,139 |
|
PAT |
6,524 |
7,083 |
7,634 |
8,186 |
8,745 |
-
We initiate coverage on Honda India Power Products limited with a “BUY” and a 6 months Target Price of ₹ 1,415
- Share :


Post a Comment
|
DISCLAIMER |
This report is only for the information of our customers. Recommendations, opinions, or suggestions are given with the understanding that readers acting on this information assume all risks involved. The information provided herein is not to be construed as an offer to buy or sell securities of any kind. ATS and/or its group companies do not as assume any responsibility or liability resulting from the use of such information.