PSP Project Limited Research Report
Market Price: ₹691 Recommendation: BUY Target: ₹871 Time Horizon: 1 Year
Q3FY2023 REVIEW
PSP Projects Limited reported net revenue of ₹500.16 crores for the quarter ended December 31, 2022, compared to ₹485.62 crores for December 30, 2021. Profit After Tax was ₹35.36 crores for the quarter ended December 31, 2022, compared to ₹50.13 crores during the corresponding quarter of the previous year, respectively.
OVERVIEW
- As of March 9, 2023, the firm had Work Orders in the institutional, industrial, and residential sectors totaling INR 123.38 Crores.
- As of January 10th, 2023, the business has received a Letter of Award (LOA) for a government project valued at INR 1,344.01 crores (exclusive of GST) for the "Construction of State of the Art High Rise Office Building" in Surat, Gujarat, for the Surat Municipal Corporation.
BENCHMARK COMPARISON
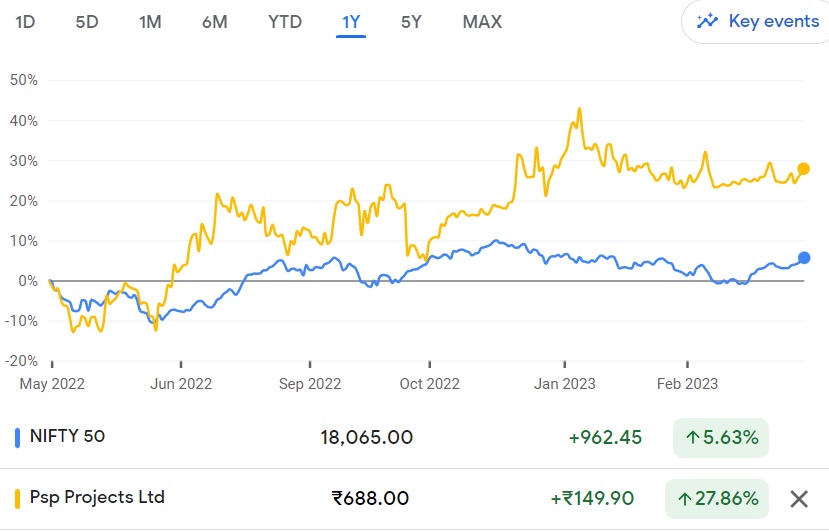
Beta: 1.02 |
Alpha: 12.36 |
Risk Reward Ratio: 1.44 |
Margin of Safety: 20% |
STOCK DATA
|
52 Week H/L |
459/776 |
|
Market Cap (crores) |
2,497 |
|
Face Value (₹) |
10.00 |
|
Book Value |
190 |
|
EPS TTM |
46.29 |
|
NSE Code |
PSPPROJECT |
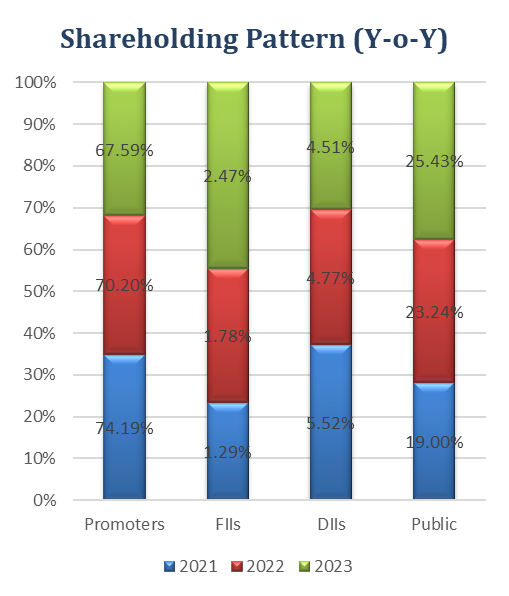
SHAREHOLDING PATTERN (%)
|
|
Sep-22 |
Dec-22 |
Mar-23 |
|
Promoter |
70.45 |
67.54 |
67.59 |
|
Public |
23.18 |
26.03 |
25.43 |
|
FIIs |
1.97 |
2.27 |
2.47 |
|
DIIs |
4.50 |
4.15 |
4.51 |
BUSINESS
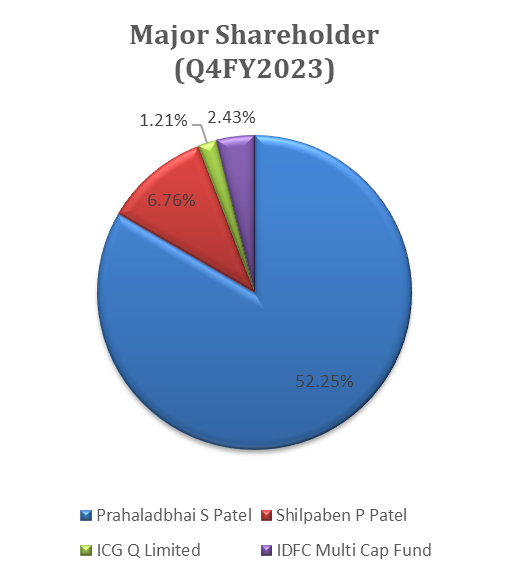
- Incorporated in August 2008, PSP Projects Limited is an Indian construction business that provides a wide variety of construction and related services for industrial, institutional, governmental, government residential, and residential projects. Mr. Prahalad S. Patel, the main promoter, has been working in the construction sector for more than three decades.
- The business offers comprehensive EPC services along the whole construction value chain, including design, construction, MEP, interior design, and O&M services.
- With operations across Gujarat, Rajasthan, Karnataka, Uttar Pradesh, Maharashtra, and New Delhi, the firm is geographically diverse.
- The firm raised Rs. 211.68 crore upon its May 29, 2017, NSE and BSE listing.
- PSP Projects is India's second-fastest-growing small construction company. It has completed 200 projects as of December 2022, building a solid rapport with reputable clients and a track record of timely project completion, both of which have enabled it to secure repeat business from its current clients, which include sizable pharmaceutical, dairy, and public sector entities.
- The firm opened a precast factory in Gujarat in December 2021 intending to offer sustainable construction solutions and technology advancements that support captive consumption.
- ₹5,075 crore are in the outstanding order book as of 9MFY23. In comparison to Rs.978 crore in 9MFY22, the business got its highest-ever order inflow of Rs.1,950 crore during 9MFY23, representing a 100% year-over-year gain.
- Revenue mix segment in Q3FY23, contribution from Government (37%), Institutional (22%), Gvt Residential (19%), Industrial(7%), Residential(10%), Precast(5%).
- Revenue Mix by Geography Gujarat generates 53% of revenues, which are followed by up 32%, Maharashtra 14%, and then Rajasthan at 0.5%.
SWOT ANALYSIS
 STRENGTH
- Tracks record of timely project completion.
- Long-standing relationships with customers.
- Company with strong financials.
- Experienced Management.
WEAKNESS
- Working capital-intensive operations.
- Relatively moderate scale of operations.
OPPORTUNITIES
- The thrust of the government on urban infrastructure development.
- Strong order book.
 THREAT
- Presence in a highly competitive industry.
- An increase in the prices of raw materials could impact the profit of the company.
INFRASTRUCTURE SECTOR ANALYSIS
- Higher government investment in infrastructure in FY24 than was anticipated this fiscal year would drive a revenue rise of 17–20% for engineering, procurement, and construction (EPC) businesses.
- The fact that the government upped the sector's spending by a staggering 33%, from Rs 7.5 lakh crore to Rs 10 lakh crore, is obvious evidence that it is employing the infrastructure capex instrument to bolster the economy in the 2023–24 budget. Lifting a post-pandemic domestic economy out of the woods while simultaneously boosting private-sector capital expenditures is the goal.
- By 2025, it is expected that India's construction market would be worth USD 1.4 trillion. The construction industry in India has over 250 sub-sectors. Under the National Infrastructure Pipeline, the nation has a USD 1.4 trillion investment budget for infrastructure, with 24% going to renewable energy, 19% to roads and highways, 16% to urban infrastructure, and 13% to railroads. Modern, technologically oriented urban planning is expected to enhance the quality of life through initiatives like the ground-breaking Smart City Mission (target of 100 cities).
- It will be possible to travel more quickly thanks to the implementation of the PM Gati Shakti Master Plan for Motorways. In 2022–2023, the National Highway network would be expanded by 25,000 km at a cost of 20,000 crore. In addition, the development of more national road segments, as well as the approval and completion of several projects and fundraising initiatives, might have a big impact on India's road sector in 2022.
- Priorities for 2022 include the development of a comprehensive, multi-modal national transportation and logistics network, linkage with isolated and difficult terrains, decongestion of key areas on the road network, and progress with the voluntary automobile scrappage plan.
- By 2027, India's infrastructure industry is anticipated to expand at a CAGR of 8.2%. An additional source of infrastructure expansion potential has been the announcement by India, the US, Israel, and the UAE of the beginning of a quadrilateral economic forum in November 2021.
- The "Infrastructure for Resilient Island States" programme, on the other hand, has demonstrated a tremendous chance to enhance the lives of fragile countries throughout the world by allowing Indian infrastructure expansion to blossom in triple-folds. This opportunity was revealed in November 2021.
FINANCIAL OVERVIEW
QUARTERLY SUMMARY
|
Quarterly (INR in lakhs) |
Dec-22 |
Sep-22 |
Jun-22 |
Mar-22 |
Dec-21 |
|
Revenue from Operations |
50015.7 |
35998.21 |
34,808.25 |
55,464.66 |
48562.01 |
|
Other income |
643.37 |
628.4 |
557.97 |
472.66 |
906.99 |
|
Total Income |
50659.07 |
36626.61 |
35366.22 |
55937.32 |
49469 |
|
|
|
|
|
|
|
|
Total Expenditure |
44821.26 |
32956.56 |
30853.12 |
47,652.15 |
41900.43 |
|
EBIT |
5837.81 |
3670.05 |
4513.1 |
8285.17 |
7568.57 |
|
|
|
|
|
|
|
|
Finance cost |
1012.82 |
704.95 |
599.4 |
945.94 |
977.32 |
|
PBT Before share of Profit/(Loss) of Joint Venture |
4824.99 |
2965.1 |
3913.7 |
7339.23 |
6591.25 |
|
|
|
|
|
|
|
|
Share of Profit/(Loss) of Joint Venture |
3.19 |
2.19 |
1 |
38.93 |
-16.65 |
|
PBT |
4828.18 |
2967.29 |
3914.7 |
7378.16 |
6574.6 |
|
|
|
|
|
|
|
|
Tax Expenses |
1292.17 |
812.7 |
1,010.99 |
1856.27 |
1561.36 |
|
PAT |
3536.01 |
2154.59 |
2903.71 |
5521.89 |
5013.24 |
PROFIT AND LOSS STATEMENT (₹ in lakhs)
|
|
Mar-20 |
Mar-21 |
Mar-22 |
|
Revenue from operations |
1,49,925.93 |
1,24,086.24 |
1,74,806.33 |
|
Other income |
2,416.63 |
1,665.78 |
2,171.64 |
|
Total income |
1,52,342.56 |
1,25,752.02 |
1,76,977.97 |
|
|
|
|
|
|
Cost of goods sold |
53,505.34 |
39,576.77 |
49,897.75 |
|
Gross Profit |
98,837.22 |
86,175.25 |
1,27,080.22 |
|
|
|
|
|
|
Excise duty |
|
|
|
|
Construction Expenses |
70,044.68 |
64,442.86 |
89,161.31 |
|
Employee benefits |
5,948.66 |
5,089.71 |
7,233.92 |
|
Other expenses |
1,344.08 |
1,483.23 |
2,669.44 |
|
EBITDA |
21,499.80 |
15,159.45 |
28,015.55 |
|
|
|
|
|
|
Depreciation and Amortisation |
2,669.55 |
2,563.76 |
3,205.28 |
|
EBIT |
18,830.25 |
12,595.69 |
24,810.27 |
|
|
|
|
|
|
Finance cost |
1,505.58 |
1,500.79 |
2,648.89 |
|
PBT before exceptional items |
17,324.67 |
11,094.90 |
22,161.38 |
|
|
|
|
|
|
exceptional items |
0.00 |
0.00 |
0.00 |
|
PBT |
17,324.67 |
11,094.90 |
22,161.38 |
|
|
|
|
|
|
Tax expenses |
4,504.49 |
2,758.33 |
5,533.91 |
|
PAT before share of profit/(loss) from Joint venture |
12,820.18 |
8,336.57 |
16,627.47 |
|
|
|
|
|
|
Share of profit/(loss) from Joint venture |
10.74 |
-241.94 |
37.76 |
|
Net profit before Non-controlling interest |
12,830.92 |
8,094.63 |
16,665.23 |
|
|
|
|
|
|
Non-controlling interest |
-16.69 |
-58.02 |
0.00 |
|
Net profit attributable to Holding company |
12,847.61 |
8,152.65 |
16,665.23 |
|
|
|
|
|
|
EPS |
|
|
|
|
Basic |
35.69 |
22.65 |
46.29 |
|
Diluted |
35.69 |
22.65 |
46.29 |
|
|
|
|
|
|
Number of shares |
|
|
|
|
Basic |
359.98 |
359.94 |
360.00 |
|
Diluted |
359.98 |
359.94 |
360.00 |
Balance Sheet (₹ in lakhs)
|
|
Mar-20 |
Mar-21 |
Mar-22 |
|
ASSETS: |
|
|
|
|
Non-current assets: |
|
|
|
|
Property, plant and Equipment |
5,158.53 |
7,735.64 |
10,214.79 |
|
Capital work-in-progress |
- |
176.31 |
- |
|
Other Intangible assets |
51.53 |
72.47 |
103.65 |
|
Financial assets: |
|
|
|
|
Investments |
382.44 |
65.68 |
65.68 |
|
Loans |
1,555.84 |
1,794.78 |
2,282.31 |
|
Other financial assets |
4,365.48 |
6,391.06 |
5,887.95 |
|
Deferred Tax Assets |
283.26 |
279.73 |
592.13 |
|
Other Non-current assets |
289.20 |
963.45 |
211.77 |
|
Total Non-current assets |
12,086.28 |
17,479.12 |
19,358.28 |
|
|
|
|
|
|
Current assets: |
|
|
|
|
Inventories |
360.83 |
3,381.26 |
7,500.17 |
|
Financial assets: |
|
|
|
|
Investments |
1,408.15 |
1,511.78 |
- |
|
Trade receivables |
5,827.76 |
12,346.31 |
14,788.52 |
|
Cash and cash equivalents |
3,408.51 |
6,162.42 |
3,554.82 |
|
Bank balance |
7,257.62 |
16,632.66 |
18,665.61 |
|
Loans |
33.14 |
417.83 |
1,078.28 |
|
Other financial assets |
1,367.55 |
1,619.25 |
5,576.34 |
|
Other current assets |
1,004.03 |
342.38 |
2,883.46 |
|
Current Tax Assets |
58.10 |
79.60 |
102.69 |
|
Total Current assets |
20,725.69 |
42,493.49 |
54,149.89 |
|
|
|
|
|
|
Total Assets |
32,811.97 |
59,972.61 |
73,508.17 |
|
|
|
|
|
|
EQUITY AND LIABILITIES: |
|
- |
|
|
Equity: |
|
|
|
|
Share capital |
2,880.00 |
3,600.00 |
3,600.00 |
|
Other Equity |
7,586.64 |
26,541.23 |
33,330.71 |
|
Equity attributable to owners of holding company |
10,466.64 |
30,141.23 |
36,930.71 |
|
|
|
|
|
|
Non-controlling interests |
60.08 |
107.56 |
85.37 |
|
Total Equity |
10,526.72 |
30,248.79 |
37,016.08 |
|
|
|
|
|
|
Non-current liabilities: |
|
|
|
|
Financial Liabilities: |
|
|
|
|
Borrowings |
336.37 |
168.49 |
40.87 |
|
Provisions |
93.04 |
- |
- |
|
Total Non-current Liabilities |
429.41 |
168.49 |
40.87 |
|
|
|
|
|
|
Current Liabilities: |
|
|
|
|
Financial Liabilities: |
|
|
|
|
Borrowings |
6,973.34 |
2,640.95 |
2,938.27 |
|
Trade payables: |
|
|
|
|
Total outstanding dues of micro and small enterprise |
- |
- |
75.23 |
|
Other creditors |
7,435.39 |
12,716.59 |
15,838.86 |
|
Other financial liabilities |
731.59 |
819.00 |
1,172.27 |
|
Other current liabilities |
5,531.84 |
12,650.82 |
15,339.17 |
|
Provisions |
5.66 |
59.58 |
47.45 |
|
Current tax liabilities |
1,178.02 |
668.39 |
1,039.97 |
|
Total Current Liabilities |
21,855.84 |
29,555.33 |
36,451.22 |
|
|
|
|
|
|
Total Equity and Liabilities |
32,811.97 |
59,972.61 |
73,508.17 |
Cash Flow Statement (₹ in lakhs)
|
|
Mar-20 |
Mar-21 |
Mar-22 |
|
Net Profit Before Tax |
17,335.41 |
10,852.96 |
22,199.14 |
|
Net Cash from Operating Activities |
1,550.85 |
7,346.94 |
14,727.31 |
|
Net Cash Used for Investing Activities |
-798.23 |
519.48 |
-16,414.11 |
|
Net Cash From (Used For) Financing Activities |
-175.11 |
-438.39 |
-1,073.29 |
|
Net Increase in Cash and Cash Equivalents |
577.51 |
7,428.03 |
-2,760.09 |
|
Cash And Cash Equivalents at The Beginning of The Year |
3,554.82 |
4,132.33 |
11,560.36 |
|
Cash And Cash Equivalents at The End of the Year |
4,132.33 |
11,560.36 |
8,800.27 |
Ratio Analysis
|
|
Mar-20 |
Mar-21 |
Mar-22 |
|
Profitability Ratio |
|
|
|
|
Gross Profit |
65.92% |
69.45% |
72.70% |
|
EBITDA Margin |
14.34% |
12.22% |
16.03% |
|
EBIT Margin |
11.56% |
8.94% |
12.68% |
|
Pre-Tax Margin |
12.56% |
10.15% |
14.19% |
|
Net Profit Margin |
8.57% |
6.57% |
9.53% |
|
|
|
|
|
|
Return on Investment |
|
|
|
|
Return on Asset – ROA |
15% |
8% |
15% |
|
Return on Capital Employed – ROCE |
45% |
25% |
40% |
|
Return on Equity – ROE |
31% |
16% |
27% |
|
|
|
|
|
|
Liquidity Ratio (x) |
|
|
|
|
Current ratio |
1.38803 |
1.53296 |
1.454 |
|
Quick Ratio |
1.19577 |
1.33553 |
1.30906 |
|
|
|
|
|
|
Turnover Ratio |
|
|
|
|
Receivables Turnover |
7.8278 |
5.37504 |
7.09404 |
|
Inventory Turnover |
6.22752 |
4.25459 |
6.76671 |
|
Payables Turnover |
2.91089 |
1.72459 |
2.47682 |
|
Asset Turnover |
1.76588 |
1.2699 |
1.5458 |
|
|
|
|
|
|
Solvency Ratio |
|
|
|
|
Debt to Equity |
0.01 |
0.01 |
0.02 |
|
Interest Coverage Ratio |
12.507 |
8.39271 |
9.36629 |
Technical Analysis
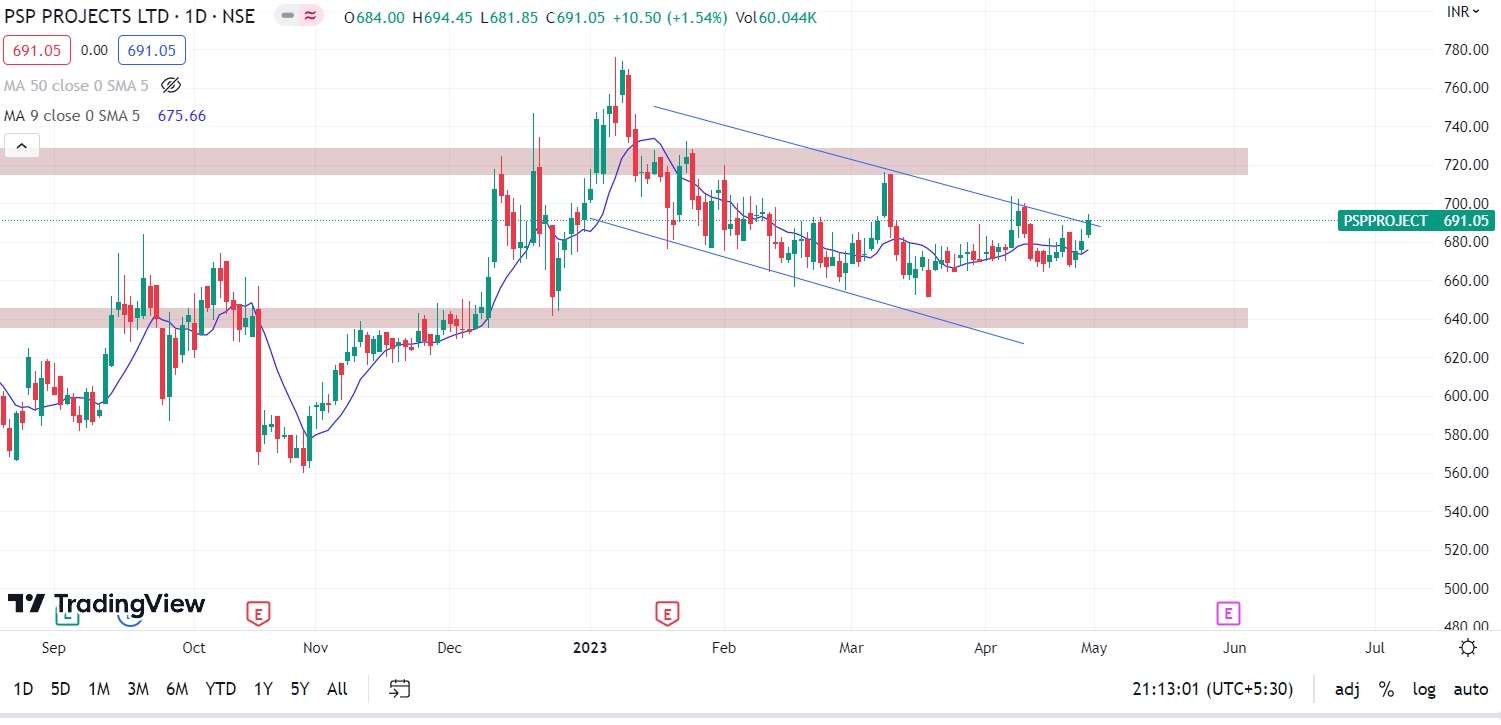
- Stock is trading above 50 days moving average and it is an upward trend on a daily chart, ₹640 and ₹720 are support and resistance levels
- One can accumulate this stock at current levels.
CONCALL (Q3FY2023)
- 5,075 crores of rupees are the outstanding order book as of 9MFY23. Most orders ever received: 1,950 crores of rupees year over year. PSP Projects received an order for a project from Surat Municipal Corporate valued at Rs. 1,344.01 crores, bringing its order book to Rs. 6,418 crores. A pipeline of bids of around Rs. 4,500 crores.
- Nearly Rs. 3,300 crores in order intake is currently anticipated to increase to between Rs. 3,900 and Rs. 4,000 crores by the end of the year. 5,075 crores worth of orders are now being fulfilled, with the projects in Bhiwandi and Pandharpur making up 14% of the total. aims to continue revenue growth of 20–25% in the upcoming year.
- The combined revenue from all 7 UP projects in Q3FY23 was Rs. 165 crores, up 2% YoY and 39% QoQ. Revenue climbed by 2% YoY in Q3FY23, however, EBITDA and net profit decreased by 17% and 25%, respectively. anticipates a 20–25% increase in income next year, with a target of Rs. 2,700 crores, to make up for any revenue loss.
- Working capital days: 79 days for debtors, 60 days for creditors, 22 days for inventories, and 41 days overall for net working capital. Inventory costs Rs. 114 crore, trade payables Rs. 300 crore, and trade receivables Rs. 400 crore. Mobilisation advance is Rs. 169 crores, while net unbilled revenue is Rs. 150 crores. There are Rs. 101 crores in non-current retention funds and Rs. 33 crores in current retention funds. Compared to last year, the company's debt has grown, albeit only by Rs. 5 crores. Due to the advance payments made to subcontractors for MEP supplies, the debt has increased.
- Mumbai, Bangalore, Delhi NCR, and Pune are the company's top four markets, and it is concentrating on expanding there. However, it sees plenty of space to grow by entering new micro markets. Market circumstances and the company's execution goals will determine the mix of outright purchases and joint ventures.
- Government and private orders are split into two groups in the company's order book, with government orders further broken down into institutional and residential orders.
- Projects about residential and office infrastructure are included in the private sector.
- Even with a decrease of Rs. 100 crores in sales this year, the company anticipates maintaining a growth rate of 20–25% in revenue for the next year. Given that the economy is expanding quickly in both the private and public sectors, the firm does not anticipate a slowdown in order inflow as a result of the impending elections.
Recommendation Rationale
- Established business and professional promoters
- Mr. Prahalad S. Patel, the main promoter, has been working in the construction sector for more than three decades.
- Additionally, PSP has built solid relationships with reputable clients and has a track record of completing projects on time for more than ten years, both of which have enabled it to secure repeat business from those clients.
- Strong debt coverage indicators and low leverage
- PSP maintained minimal leverage as of March 31, 2022, as evidenced by an overall gearing of 0.35x, which softened from 0.21x at the end of FY21 due to increased mobilisation advances.
- Debt coverage indicators were strong as of the end of FY22 when total outside liabilities (TOL) to total net worth (TNW) was 0.85x and interest coverage was 9.84x.
- Strong order book position from reputable clients:
- PSP had a solid medium-term revenue visibility as of December 31, 2022, with an order-book-to-TOI ratio of 2.90x and an outstanding order-book of 6,481 crores as of that date. PSP, however, is exposed to inherent counterparty risk because 52% of the orders come from state government organisations.
- The government's emphasis on healthcare development also makes state governments more focused on on-time project completion, somewhat reducing the danger of cash flow.
- construction of a new precast material manufacturing facility:
- Near Sanad, Gujarat, PSP has established a precast concrete and related element manufacturing facility with a 1 million square foot production capacity.
- The facility was built at a total cost of about 109 crore rupees, with 33 crore rupees going towards an equipment loan and 33 crore rupees towards internal accruals spent during FY21 and FY22. As of September 30, 2022, the precast has an order book worth 236 crore rupees.
Valuation
- PSP Projects Limited has shown revenue growth of 14% CAGR for FY2018-2022.
- Net Profit has shown a growth rate of 26% CAGR for FY2018-2022.
- The company’s ROE and ROCE are 27% & 40% for FY2022.
- We estimate the company could generate higher revenue and net profit for the following FY 2023, comparable to the prior year, based on the company's present performance in FY 2022.
- To project income for the fiscal years 2023–2027, we used data from the previous five years (2018–2022).
Estimated Income Statement (₹ in lakhs)
|
|
Mar-23 |
Mar-24 |
Mar-25 |
Mar-26 |
Mar-27 |
|
|
2023-E |
2024-E |
2025-E |
2026-E |
2027-E |
|
Revenue |
1,85,401.53 |
2,60,528.44 |
3,66,327.16 |
5,15,332.75 |
7,25,203.85 |
|
COGS |
66,076.79 |
90,229.95 |
1,27,111.32 |
1,79,067.91 |
2,52,261.69 |
|
Gross Profit |
1,19,324.74 |
1,70,298.50 |
2,39,215.84 |
3,36,264.84 |
4,72,942.16 |
|
Construction Expenses |
90,537.55 |
1,27,544.66 |
1,79,678.37 |
2,53,121.68 |
3,56,584.83 |
|
Employee Expenses |
7,405.63 |
10,432.68 |
14,697.02 |
20,704.41 |
29,167.31 |
|
Other Expenses |
1,919.73 |
2,704.42 |
3,809.85 |
5,367.12 |
7,560.92 |
|
EBITDA |
19,461.82 |
29,616.74 |
41,030.60 |
57,071.64 |
79,629.10 |
|
Depreciation |
3,635.47 |
4,733.53 |
6,347.84 |
8,677.69 |
12,005.90 |
|
EBIT |
15,826.35 |
24,883.21 |
34,682.76 |
48,393.95 |
67,623.21 |
|
Financial Cost |
1,885.73 |
2,964.86 |
4,132.49 |
5,766.19 |
8,057.38 |
|
EBT |
13,940.63 |
21,918.35 |
30,550.28 |
42,627.76 |
59,565.83 |
|
Tax expenses |
3,485.16 |
5,479.59 |
7,637.57 |
10,656.94 |
14,891.46 |
|
PAT |
10,455.47 |
16,438.76 |
22,912.71 |
31,970.82 |
44,674.37 |
Nayan Nahar Shubham Titvilasi
Equity Research Analyst Equity Research Analyst
Ph: 8149629086 Ph: 7415440968
Email: nayannahar23@gmail.com Email: shubham.titvilasi@gmail.com
- Share :


Post a Comment
|
DISCLAIMER |
This report is only for the information of our customers. Recommendations, opinions, or suggestions are given with the understanding that readers acting on this information assume all risks involved. The information provided herein is not to be construed as an offer to buy or sell securities of any kind. ATS and/or its group companies do not as assume any responsibility or liability resulting from the use of such information.